 |
 |
 |
Multi_R_Designer
Tutorial |
 |
 |
 |
aa
MEXA (Model EXpert Advisor)
MEXA is a tool helping the user to find the best
model predicting hydrodynamics, mass or heat transfer properties providing
a range of operating conditions such as velocities, fluid properties and
packing properties (common model inputs). If the user wants to predict,
for example, total liquid holdup for specific operating conditions, he
can assign a range for the liquid and gas velocities, particle dimensions
and choose one or several models available in the Multi_R_Designer simulator.
MEXA will find the number of experimental data in the Multi_R_Designer
integrated databank matching the specified conditions and will divulge
the performance of the selected models on these data. With this tool, the
user can determine the model or correlation exhibiting the best prediction
capability of the studied property for the operating condition setup.
In the example presented here, we will determine
the best model predicting the total liquid holdup in trickle beds for a
set of operating conditions which can be either stored in a file or introduced
in the MEXA using the data range table.
If the first option (operating conditions stored
in a file) is used for MEXA inquiry, it can be done after a simulation.The
appropriate procedure for creating a user's file and carrying out simulations
is presented in sections Frame
for user's file and manual
simulation respectively. Once the simulation
is done, start a MEXA inquiry from STEP 4
below.
If the inquiry is based on a range of operating
conditions, the following steps are used:
STEP 1:
-
Select Simulation/Start new simulation from the main menu
 .
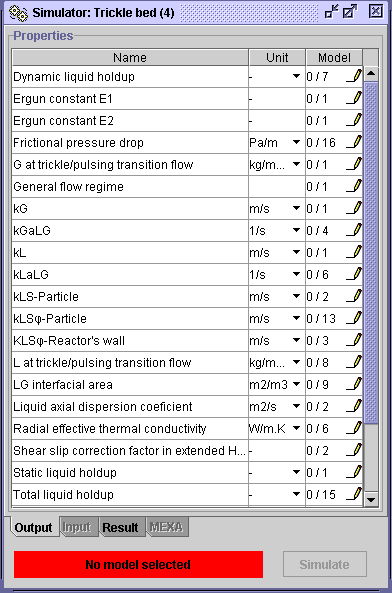
The user is introduced to the Simulator: Trickle bed dialog window.
The red space bar at the bottom of the dialog window warns that no model
is selected. For Total liquid holdup in the Model field,
0/15
means that none of the 15 available models are selected.
STEP 2:
-
Click on the pencil
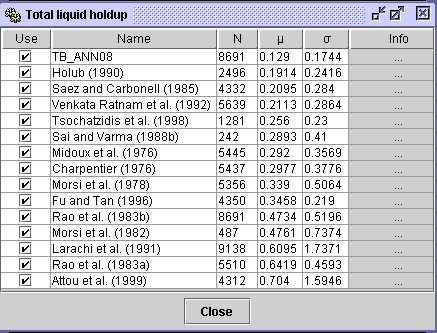
 in the Model field. Models available to predict total liquid holdup
are depicted in a
Total liquid holdup dialog window.
-
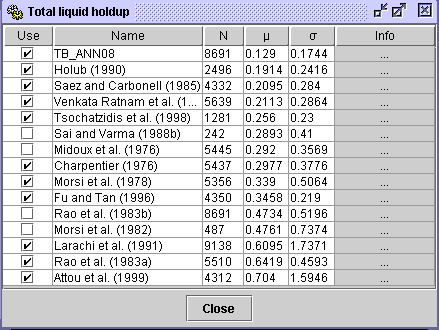
All models can be selected by clicking on the Use heading while
the check boxes can be used to select only some models. In this example,
all available models are considered. TR_ANN08 is the neural network
correlation developed at Laval University for predicting total liquid holdup.
Symbol N is the number of experimental data in the Multi_R_Designer
integrated databank on which the models were simulated,
 and
and associated
to the models refer to the Average
Absolute Relative Error (AARE)
and standard
deviation on absolute relative error, respectively.
STEP 3:
-
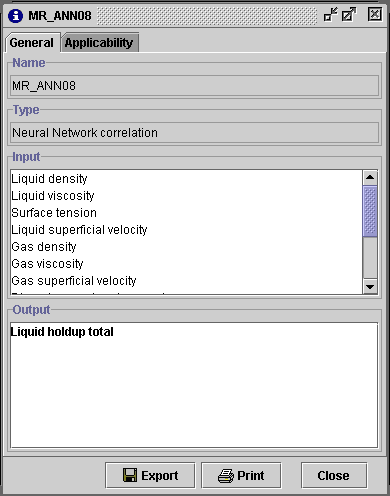
Information about the selected model is available in Info.
-
In the General tab for TR_ANN08 (figures below), the model
reference (Name) is given as well as the Type (Neural network
correlation), the model Input list in dimensional form (liquid density,
gas density ...) and the Output also in dimensional form.
-
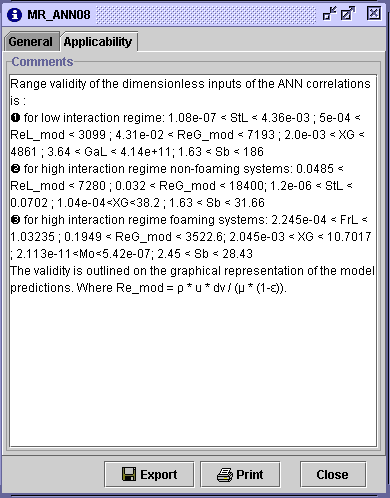
In an Applicability tab, the domain of validity for each model input
is given in the unit of your choice. All these information can be printed
or saved in a .html file by clicking on Export. These information
gives a quick overview of the models in order to determine if they are
applicable based on te studied operating conditions (i.e. if they are valid
only for high interaction flow regime or non-Newtonian fluids).
STEP 4:
-
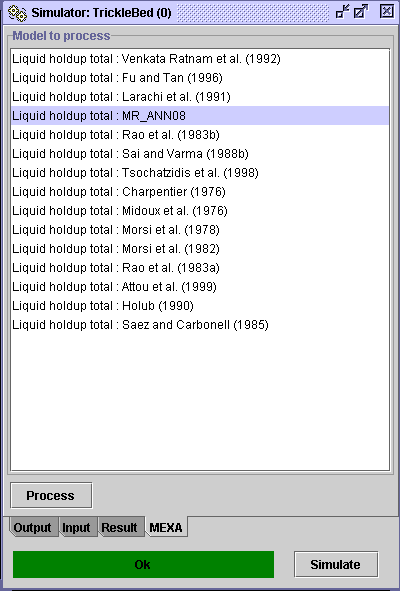
Select MEXA at the bottom of the
Simulator:TrickleBed
dialog
window. The list of models selected in STEP 2 is given and the user
can start its investigation to determine the best model/correlation predicting
total liquid holdup regarding the specified operating conditions.
-
Select a model (TR_ANN08 for this example) and click on Process.
STEP 5:
-
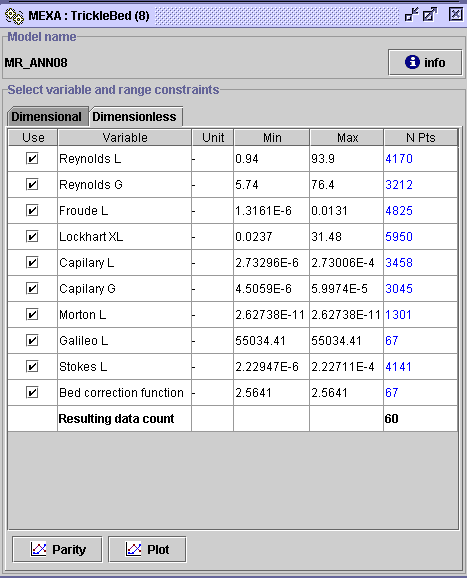
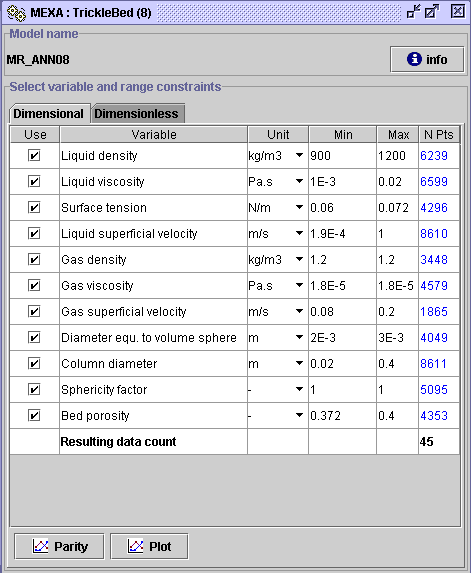
The user is introduced to the MEXA: TrickleBed dialog window. The
model's inputs in dimensional form are given with their range of variation
within the simulation file. Otherwise, introduce the minimum and
maximum values for each variables of interest. First, specify the unit
for each variable in the Unit list, then write the Min and
Max
values. The number of experimental data in Multi_R_Designer
integrated databank fulfilling the specified range is displayed
in the corresponding
N Pts entry.
-
For a liquid density varying between 900 to 1200 kg/m3,
MEXA
has found 6239 experimental data which lies within this range in
the Multi_R_Designer integrated databank. Resulting data count
gives the resulting number of data sets in the Multi_R_Designer integrated
databank matching all input specification ranges (Liquid density, Liquid
viscosity, Surface tension, Liquid superficial velocity, Gas density, Gas
viscosity, Gas superficial velocity, Diameter equivalent to volume sphere,
Column diameter, Sphericity factor, Bed porosity).
-
In this example, 45 experimental total liquid holdup data which
fulfils all input specifications are found. Obviously, this number would
become greater if less inputs were specified (deselect the inputs using
the check boxes in the Use field).
 |
-
Dimensionless inputs are given, when possible, in the Dimensionless
tab. For the TR_ANN08 correlation, there is ten dimensionless numbers
as inputs and
60 experimental total liquid holdup data matching
the dimensionless input specification ranges.
STEP 6:
-
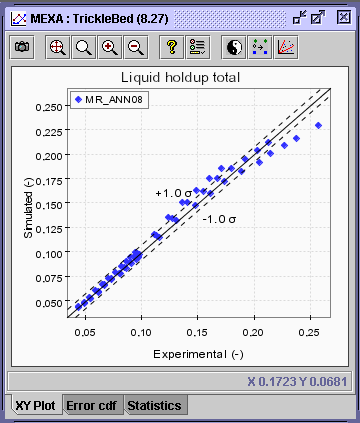
The parity plot of the simulated versus experimental total liquid holdup
found in the Multi_R_Designer integrated databank can be visualized
for each type of selection (dimensional or dimensionless) by pressing on
Parity.
-
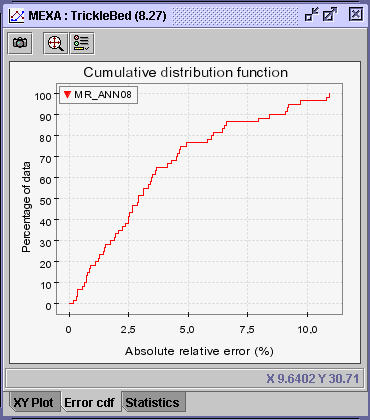
To have the cumulative distribution error of the selected model on these
experimental data, press on Error CDF.
-
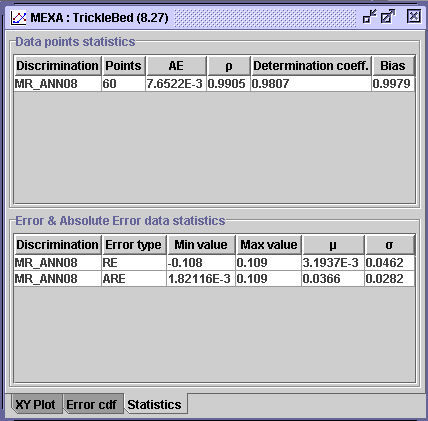
For the statistic, press on Statistics tab.
For the specification ranges imposed above, the TR_ANN08 correlation
gives with the dimensional inquiry (45 data), a correlation
coefficient ( )
of 99%, an AARE (
 )
of 3.6% and a standard deviation
(
 )
of 2.8%.
To compare the models performances, repeat the procedure with a new
model/correlation starting from STEP 4: "select a model and click
on Process" with the same variable range specifications.
STEP 7:
-
The variation of the extracted total liquid holdup data versus operating
conditions can also be visualized by selecting the Plot button at
the bottom of the MEXA: Trickle bed dialog window, where the selection
of the variable range specifications is done (STEP 5). Other
experimental properties in Multi_R_Designer matching the range constraints
specified above can also be graphically represented.
 |
 |
 |
Multi_R_Designer
Tutorial |
 |
 |
 |
