| Multi_R_Designer Quick Guide Manual |
GRAPHICAL REPRESENTATION
The Plot
creator dialog window presents two panels:
- Standard panel, where two types of plot can be created:
- Advanced panel, where a quantitative variable is assigned as the discriminate.
- 1) Parity plot: Experimental value (on the horizontal axis)
versus one or several model predictions (on the vertical axis ).
2) XY plot: Any variable versus an other. Several variables can not be represented simultaneously on the same vertical axis. aa
aa
XY PLOT / PARITY PLOT: Many options are available relatively to graph edition:
-
Photo camera icon
 : saves the graphic into an image .jpg file at any given time.
 -
Zoom To Fit
 : adjusts the axes scale to its original presentation.
 -
Zoom
 : delimits and zoom a section on the diagram (Warning: If the selection
on the graph surpasses or even touches one of the axis, the zooming process
will not execute).
 -
Zoom In
 : reduces the axis scaling.
 -
Zoom Out
 : enlarges the axis scaling.
 -
Information on selected points
 : enables the user to select a group of points on the diagram. In
the Information on selected points
dialog
window, the coordinates of the selected points are displayed as well as
the exact source (reference, figures, tables).
 -
Edit graphic properties
 : changes the diagram appearance under four panels: Text, Appearance
, Axis and Series.
- In the Text panel, the graph main title and axis titles can be modified as well as their font and color.
- In the Appearance panel, the graphic background color, the position of the legend and the grid lines color can be modified.
- In the Axis panel, the min-max range of the axis scaling can be set up (normal or logarithm) automatically or manually.
- In the Series table, the shape and color of series data can be modified.
-
Discriminate series
 :
two kinds of discrimination can be carried out on the graphics:
 -
Show only valid points
 :
removes or resets the invalid points (hollow symbols on graphics).
 -
Edit envelopes
 : By default, the RMSE
envelopes
based on the first correlation/model in the legend are drawn on parity
plots. The user can choose in the Edit envelopes
dialog window
between No envelopes, RMSE envelopes or Relative envelopes (AARE).
The
RMSE
envelopes and Relative envelopes are based on the statistics
of the chosen correlation/model from the list given below the No envelopes
section.
ERROR CDF: Performance of the models can be visualized on cumulative distribution function error diagrams presented in the Error CDF panel. The best model corresponds to the one presenting a maximum data percentage (on the vertical axis) for low absolute relative error (left part of the horizontal axis). Some options (icons) in the Parity plot panel are also available. Model performance based on the discriminated series
STATISTICS: Performance of the models is statistically
evaluated in a panel divided in three tables: Data point statistics
, Relative error statistics and Absolute relative error statistics
. Theses statistics are based on calculation where the experimental
data are represented on the X-axis and the calculated data
on the Y-axis.
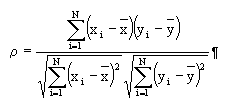
In the following definitions xi is the experimental data
and yi the predicted value.
The mean values are defined as:
 and
and 
ALL tables:
Discrimination: The model's name and/or the discriminated
series (values if quantitative variable or names if qualitative variable)
are given in this section.
DATA POINT STATISTICS table:
RMSE: Square root of the mean square error

a
rho: Correlation coefficient

a
DC: Determination coefficient

RELATIVE ERROR STATISTICS table:
mu (ARE): Mean value of the relative error

AA
sigma (sigmaRE): Standard deviation of the relative
error:

ABSOLUTE RELATIVE ERROR STATISTICS table:
mu (AARE): Mean value of the absolute relative error

sigma (sigmaARE): Standard deviation on the absolute
relative error

