| Multi_R_Designer Tutorial |
Sub-problem 6.1:
General prediction characteristics of 3 literature correlations on frictional
pressure drop based on the whole integrated databank
1) Start a new query by selecting
Start
new query ![]() .
.
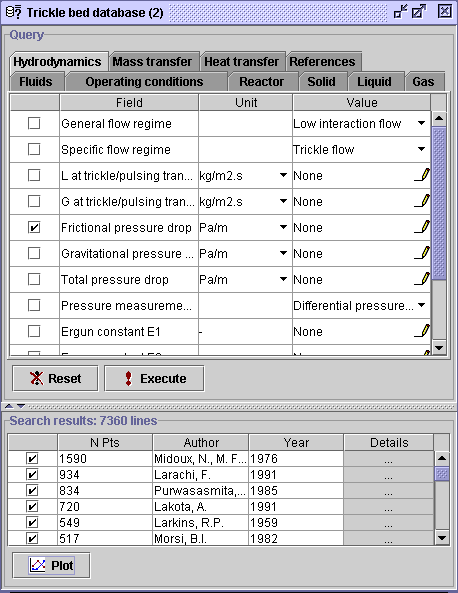
2) In the Hydrodynamics tab, check the box corresponding to Frictional pressure drop and Execute. A total of 7360 frictional pressure drop measurements were extracted from the integrated databank and will be used to analyze the literature correlations (Attou et al. (1999), Larachi et al. (1991), and TB_ANN09). Informations about the models/correlations available in the Simulation section could help the user to do the pertinent selection.
3) Select the Plot
button ![]() to enable the plot creator.
to enable the plot creator.
4) In the Horizontal axis panel (Standard tab), click on the knob corresponding to Hydrodynamics, then on the knob corresponding to Frictional pressure drop. Highlight Experimental.
5) In the Vertical axis
panel, click on Hydrodynamics, then on Frictional pressure drop.
Highlight
Attou et al. (1999), Larachi et al. (1991) and TB_ANN09
(N.B.
To select several items, click on one item (i.e. Attou et al. (1999)),
hold the Ctrl button on the keyboard and click on
Larachi et
al. (1991) and on TB_ANN09).
 |
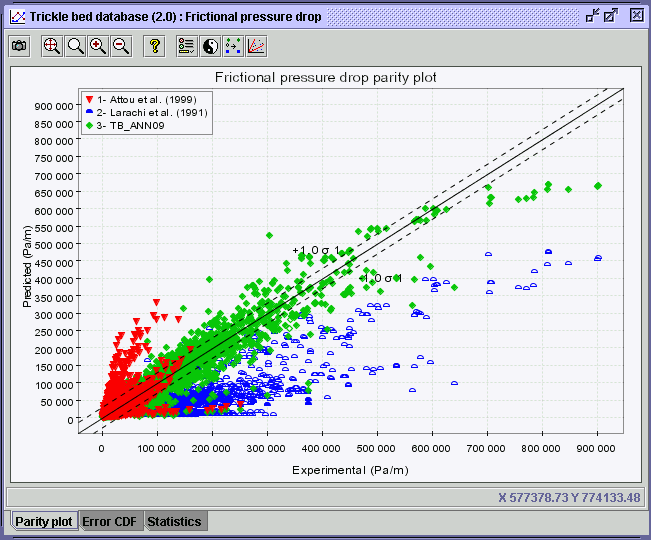 |
6) The diagram is composed of 3 panels, namely Parity plot, Error CDF and Statistics.
7) Parity plot offers the
same options as the normal XY plots elaborated in previous case problems
with the addition of two options ![]() &
& ![]() which are described below. The Parity plot panel contains the parity
diagram with a legend, a diagonal line and error envelopes. The parity
plot series for each studied correlation on the 7360 available experimental
data are provided on the diagram. Here are some procedures for an efficient
use of parity plots.
which are described below. The Parity plot panel contains the parity
diagram with a legend, a diagonal line and error envelopes. The parity
plot series for each studied correlation on the 7360 available experimental
data are provided on the diagram. Here are some procedures for an efficient
use of parity plots.
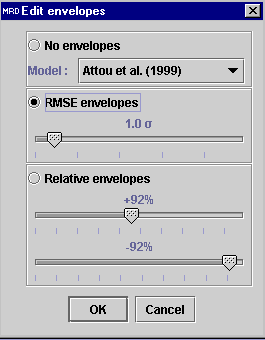
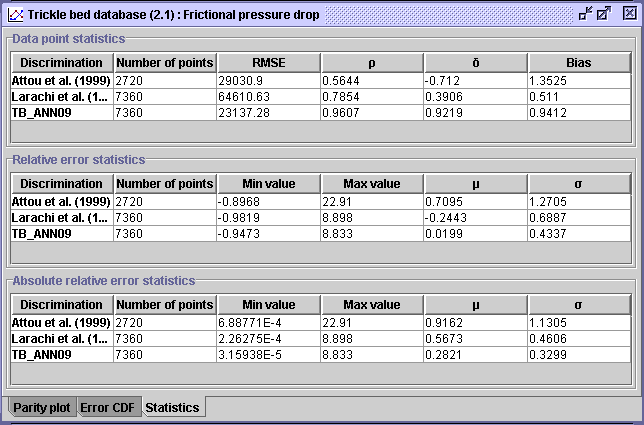
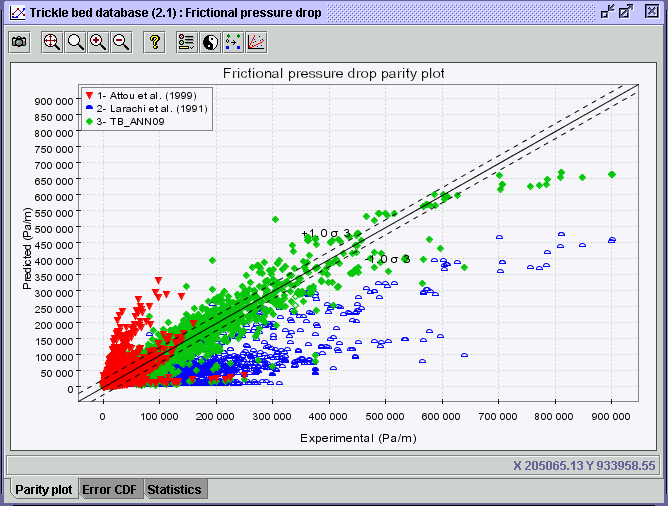
The RMSE value has been calculated for each correlation and presented in Statistics panel. In the present case, the RMSE based on 2720 values for Attou et al. (1999) model is 29030.9. Therefore, the RMSE envelopes correspond to (X=X; Y=X+29030.9) and (X=X; Y=X-29030.9). The user can also modify the RMSE envelopes between 0.1 RMSE and 9.9 RMSE for his own purpose. If the user changes the XY normal scaling into a logarithmic scaling, the RMSE envelopes will automatically disappear since it can not be represented in such a way. Instead, the Percentage envelopes based on Attou et al. (1999) Average Absolute Relative Error (AARE) will take over. This value corresponds to the average value ( field) in the third table for Attou et al. (1999). This value corresponds to 0.9162 or 91.6%.
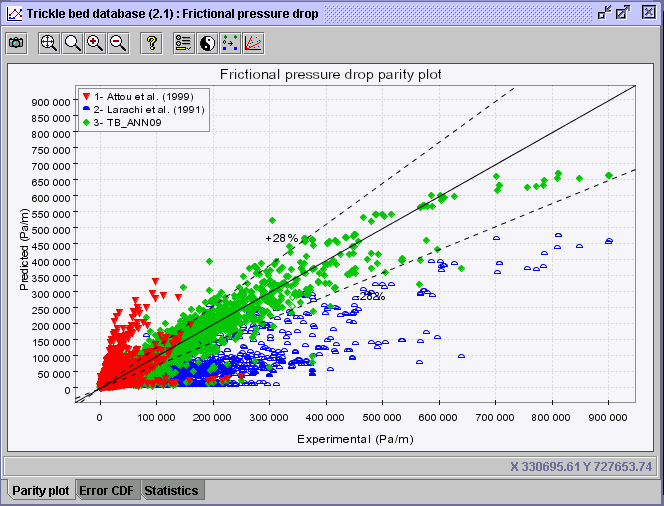
The positive Relative envelope can be settle between 1% and 200% while the negative Relative envelope varies between -1% to -99%.
 |
 |
- In the combo box
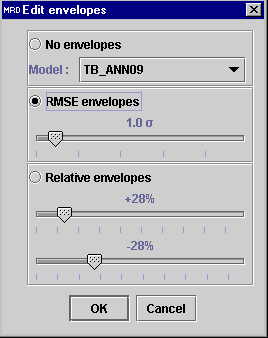
above the RMSE envelopes option, the user have the opportunity to choose between the 3 correlations. For example, it is expected that by choosing TB_ANN09 the envelopes will come closer to the diagonal (RMSE = 23137.28) as shown on the following diagram. Select TB_ANN09 and the RMSE envelopes option, then press OK (Note: envelope titles become +1.0
3 and -1.0
3 since TB_ANN09 is the third correlation in the legend).
 |
 |
- In the Edit envelopes
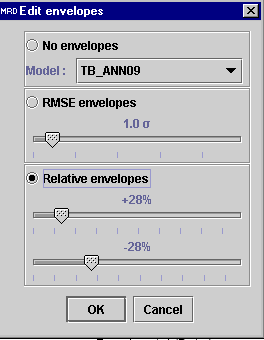
window dialog, choose the Relative envelopes option for the TB_ANN09. By default, the envelopes are settled at 28%, which is the AARE of the correlation. Press OK.
 |
 |
- Change the normal scaling into logarithmic scaling. From Edit graphic properties
, select the Axis tab and check the box corresponding to Logarithmic scale in the Horizontal tab. For parity plots, the logarithmic scaling for the vertical axis is automatically activated. Press OK.
- Select the Edit envelopes
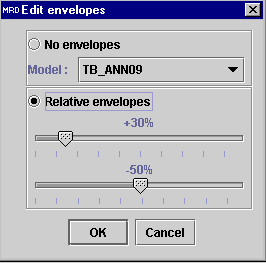
button. The RMSE envelopes option have disappeared. Adjust the percentage envelopes to +30% and -50%. Press OK.
 |
.gif) |
.gif) |
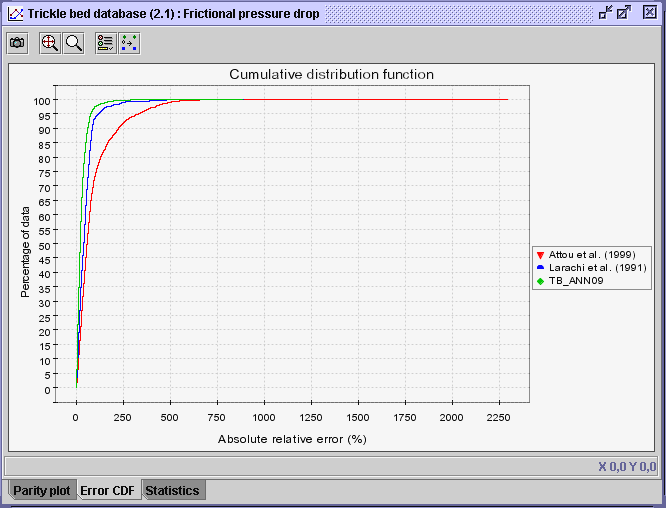
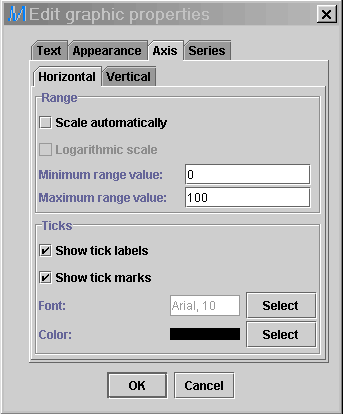
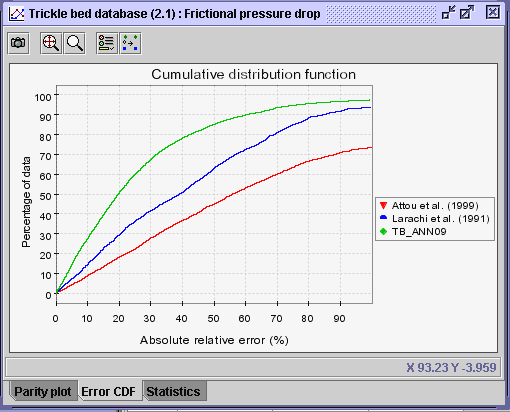
8) Error CDF (or Cumulative Distribution Function) diagram disposes the Absolute Relative Error (ARE) in an increasing progression (lowest ARE to highest ARE values for the studied database) on the X-axis as a function of the data rank percentage on the Y-axis (ARE rank divided by the total number of data).
 |
 |
 |
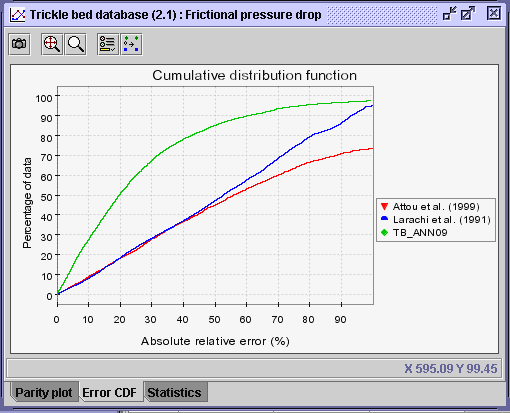 |
CONCLUSION #2: Generally, the CDF diagram including the invalid predictions and the CDF diagram without the invalid predictions exhibit pretty much the same characteristics. Based on the last CDF diagram (with invalid predictions), 80% of the studied data presents an Absolute Relative Error (ARE) below 40% for the TB_ANN09 correlation. On the other hand, only 38% of data for Larachi et al. (1991) correlation and Attou et al. (1999) model were predicted below an ARE of 40%. It further corroborates Conclusion #1, establishing that TB_ANN09 generally produces better predictions compared to the other two correlations.
9) The Statistics panel provides an assortment of statistical information associated with the points drawn on the parity plot. The Attou et al. (1999) model is applicable on 2790 points (see info while the two other correlations are applied for the hole data (7360) extracted from the search result. May be this 2790 points correspond to low interaction flow regime for which the Attou et al. model is valid. This hypothesis could be verified by a discrimination on the flow regime as it is shown in the STEP 10.
The statistical calculations obtained for the three models are presented as below :
 |
10) 2790 data estimated by the Attou et al. (1999) model
correspond to the low ineraction flow regime for which this model is applicable.
To verify this, in Parity plot panel, press
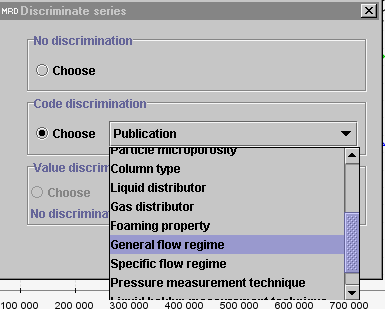
the Discriminate series ![]() icon. Activate the Code Discrimination option and highligth
General flow regime.
icon. Activate the Code Discrimination option and highligth
General flow regime.
In the statistics table, 0 points for the High interction
flow and Transition low/high interaction flow means that no
frictional pressure drop were estimated for these flow regimes. Then,
2720 = 2211+499 are the number of points estimated
for the low interaction flow (N.B. Not available (flow) means that
this information is not experimentally available in MRD_integrated
databank but evaluated by the default model (i.e. TB_ANN10) during the
automatic simulation using all models/correlations).
 |
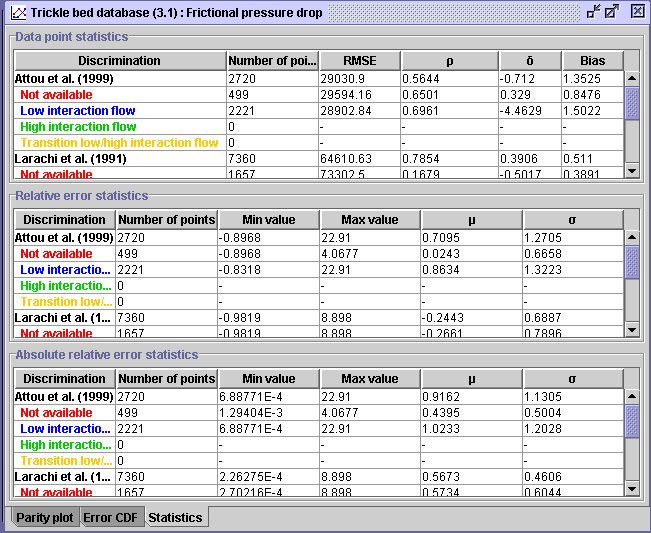 |
CONCLUSION #3: The statistical tabulation above, which
by the way includes the invalid predictions, showcases without a doubt
that the TB_ANN09 correlation predicts better the frictional pressure
drop. It has the lowest RMSE at ca. 23000 Pa/m, the
closest correlation coefficient to 1 (0.96) and the lowest AARE
(![]() in
the third table) at 0.28. On the other hand, the Bias, the
second table features and the AARE standard deviation (
in
the third table) at 0.28. On the other hand, the Bias, the
second table features and the AARE standard deviation (![]() in
the third table) are inconclusive compared to the other correlations. Moreover,
the Attou et al. (1999) model is applicable only for the low interaction
flow regime.
in
the third table) are inconclusive compared to the other correlations. Moreover,
the Attou et al. (1999) model is applicable only for the low interaction
flow regime.
| Multi_R_Designer Tutorial |