| Multi_R_Designer Tutorial |
1) Open the file (Case
problem I.mr) as it was saved in Case problem
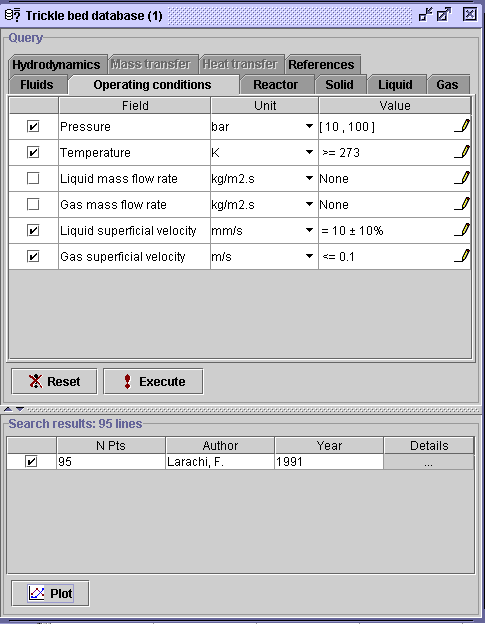
I. In the Hydrodynamics tab, unselect Total pressure drop
and select Frictional pressure drop. Press the Execute
button. The following
Query panel
containing the reduced
Search results list in accordance with the
problem specifications is opened.
 |
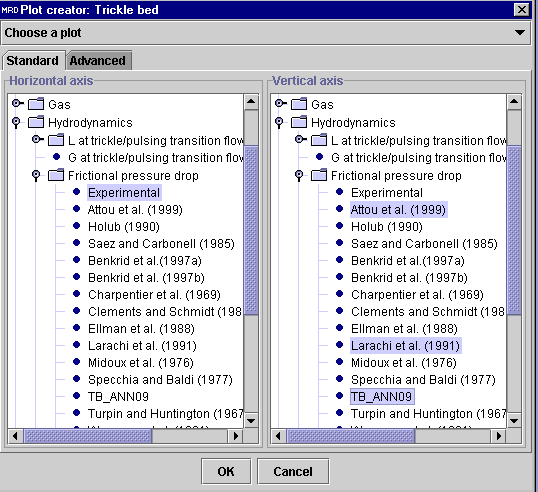
2) Select the Plot
button ![]() to enable the plot creator.
to enable the plot creator.
3) In the Horizontal axis panel (Standard tab), click on the knob corresponding to Hydrodynamics, then on the knob corresponding to Frictional pressure drop. Highlight Experimental.
4) In the Vertical axis panel, click on Hydrodynamics, then on Frictional pressure drop. Highlight Attou et al.(1999), Larachi et al. (1991) and TB_ANN09.
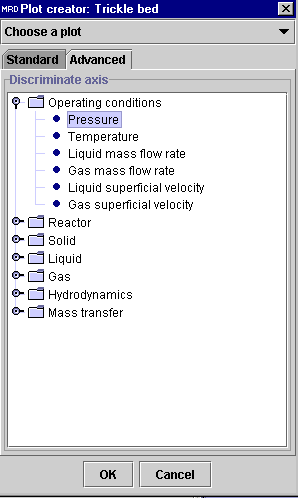
5) In the Advanced tab,
click on
Operating conditions and highlight
Pressure. Press
OK.
The following diagram will be created.
 |
 |
6) The default envelopes (RMSE
envelopes) is based on the first model selected in the Plot creator
i.e. Attou et al. model.
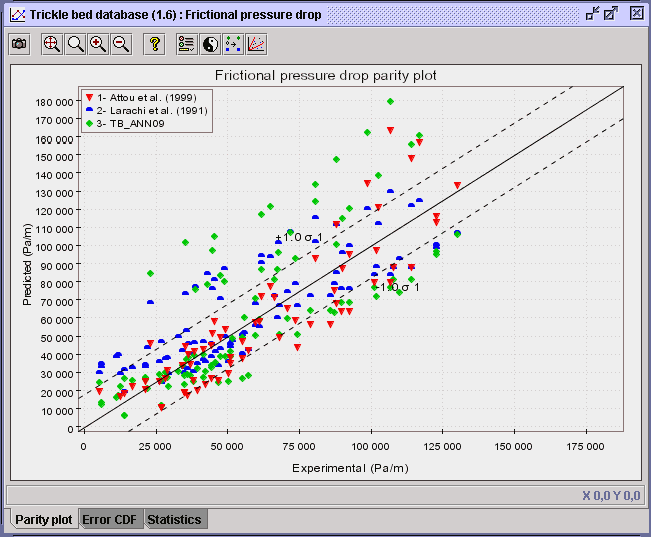 |
7) The three models seem to give an equally acceptable prediction
of the frictional pressure drop. A more accurate analysis could be
obtained from the Statistics table.The Attou et al. model is applicable
only on 69 points (low interaction flow regime) while the other
two correlations are applied on the 95 experimental data sets.
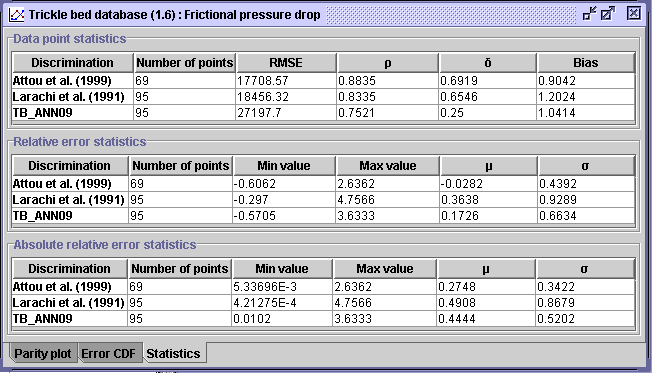 |
CONCLUSION #1: The Attou et al. (1999) model
clearly predicts the best the frictional pressure drop with the lowest
AARE (0.275) and the highest correlation coefficient (![]() =0.88).
This conclusion changes from Conclusion
#1 in Sub-problem 6.1, where the TB_ANN09
correlation presented much better qualities based on the whole databank
for frictional pressure drop. For further analysis, it would interesting
to discriminate the current plot in function of pressure since its range
is wide enough [10-100 bars] to create several sub-divisions.
=0.88).
This conclusion changes from Conclusion
#1 in Sub-problem 6.1, where the TB_ANN09
correlation presented much better qualities based on the whole databank
for frictional pressure drop. For further analysis, it would interesting
to discriminate the current plot in function of pressure since its range
is wide enough [10-100 bars] to create several sub-divisions.
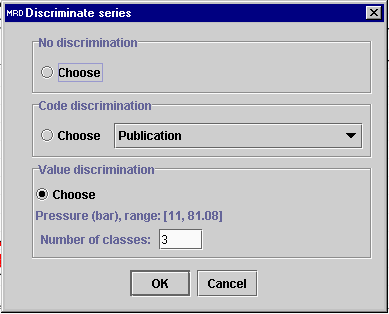
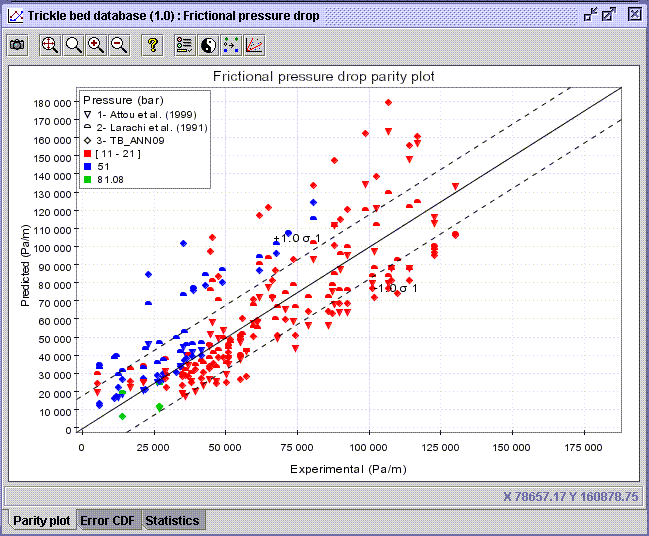
8) Select the Discriminate
series ![]() icon. Activate the Value discrimination option, and write 3
in the Number of classes entry. Press OK. The following diagram
with a double discrimination based on the correlations and pressure sub-divisions
is presented to the user (N.B. After a discrimination, the envelopes do
not change).
icon. Activate the Value discrimination option, and write 3
in the Number of classes entry. Press OK. The following diagram
with a double discrimination based on the correlations and pressure sub-divisions
is presented to the user (N.B. After a discrimination, the envelopes do
not change).
 |
 |
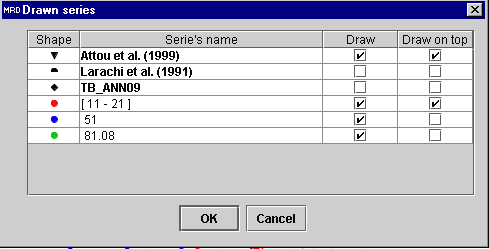
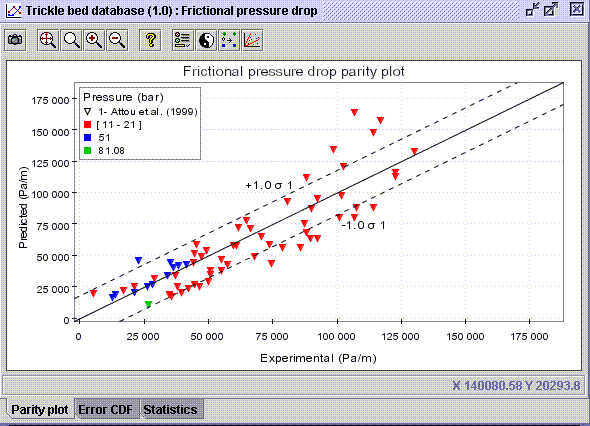
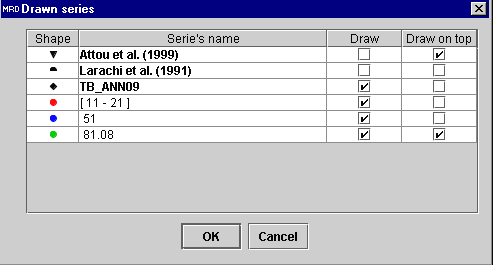
9) Right click on the legend.
The following dialog window offers the possibility to remove some series.
Unselect in the Draw field, the Larachi et al. (1991) and
TB_ANN09
correlations while keeping all the pressure sub-divisions. Press OK.
sa
Comment: The Draw
on top field assigns a serie to be drawn over the others for better
view if necessary. In this case, the [10-21] sub-division applied
on the Attou et al. (1999) model is drawn on top.
 |
 |
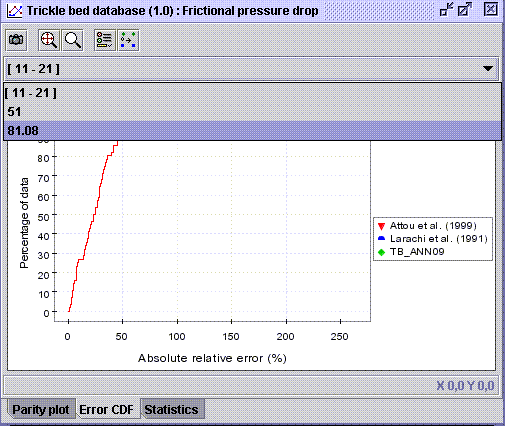
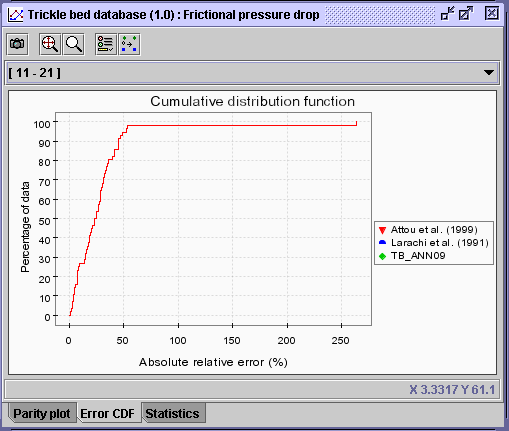
10) When discriminating, a
combo box ![]() in the Error CDF panel which contains the discriminating series
title appears. In this case, 3 choices are offered to the user and the
CDF curve can drawn for either one of them.
in the Error CDF panel which contains the discriminating series
title appears. In this case, 3 choices are offered to the user and the
CDF curve can drawn for either one of them.
aa
Comment: As mentioned
previously, the Parity plot and Error CDF panels are inter-connected
in many ways. As a consequence, the TB_ANN09 and Larachi et al.
(1991) correlations, which were withdrawn from the parity plot, are
not presented on the CDF curves. Generally, the CDF curves are generated
when the corresponding serie in the parity plot is shown.
 |
 |
11) When discriminating, new
fields are added in the Statistics panel. For each correlation,
the statistics based on every predictions without considering the discrimination
and invalidity specifications are offered. Then, the statistics exclusively
associated with the Shown points in the parity plot are also given.
For Attou et al. (1999), 69 points are actually shown on
the parity plot while the other two correlations, which were temporally
withdrawn from the plot, presents empty cells. Finally, the discriminated
series (sub-divisions of the Shown points) statistics gives a good
look on the capacity of the model to estimate frictional pressure drop
for specific operating conditions.
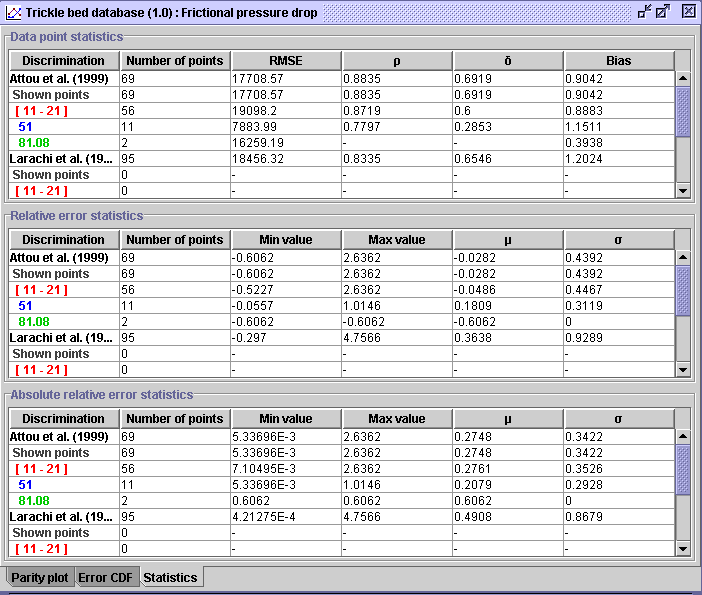 |
CONCLUSION #2: The Attou et al. (1999) model seems more accurate for pressures surrounding 51 bars. For the 11 studied data in this range, the correlation manifests an Average Absolute Relative Error (AARE) of ca. 20% while the predictions for pressures near 81 bars are slightly off-track (AARE=60%).
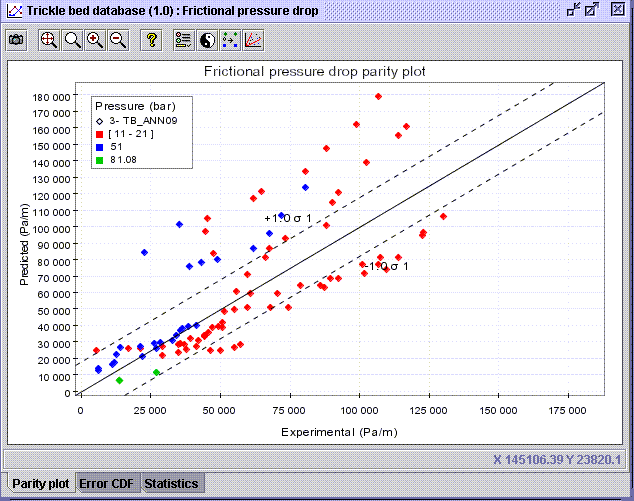
12) To analyze the TB_ANN09
correlation, right click on the legend box. Unselect Attou et al. (1999)
and re-select TB_ANN09. Press
OK.
 |
 |
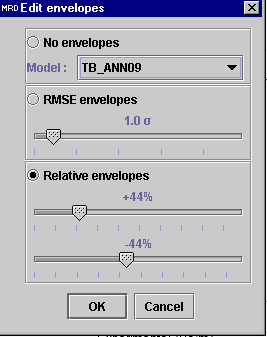
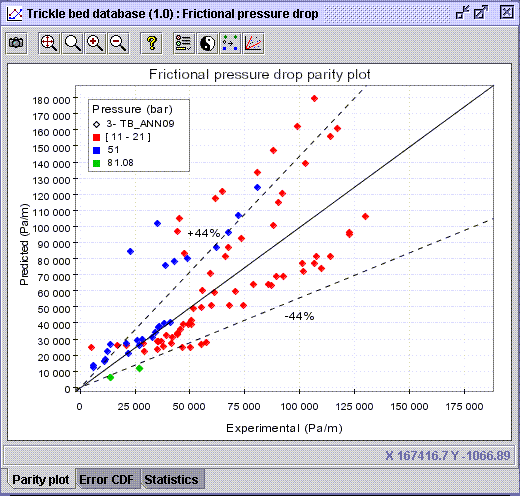
13) The envelopes have disappeared
since it was set up for the Attou et al. (1999) correlation. Return
in the Edit envelopes ![]() panel. In the combo box
panel. In the combo box ![]() ,
choose TB_ANN09. It has automatically switched to the Relative
envelopes option and adjusted the envelopes to +35% and -35%, which
corresponds to the average absolute relative error (AARE) of the TB_ANN09
correlation. Press OK.
,
choose TB_ANN09. It has automatically switched to the Relative
envelopes option and adjusted the envelopes to +35% and -35%, which
corresponds to the average absolute relative error (AARE) of the TB_ANN09
correlation. Press OK.
 |
 |
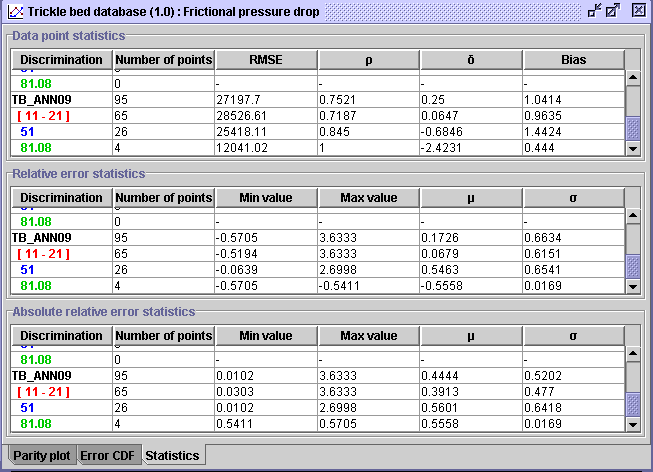
14) In the Statistics
panel, only the TB_ANN09 correlation contains statistical values.
First, it attest that all studied data are valid (TB_ANN09 Points
= Shown points = 95). The data repartition is given
as follows: Pressure [11-21] bars - 65 experiments; Pressure [51] bars
- 26 experiments; Pressure [81.1 bars - 4 experiments.
 |
15) To compare, simultaneously, the performance of the three
model/correlation, right click in the legend box and select Attou et
al. (1999) and Larachi et al. (1991).
The following statistics are then obtained:
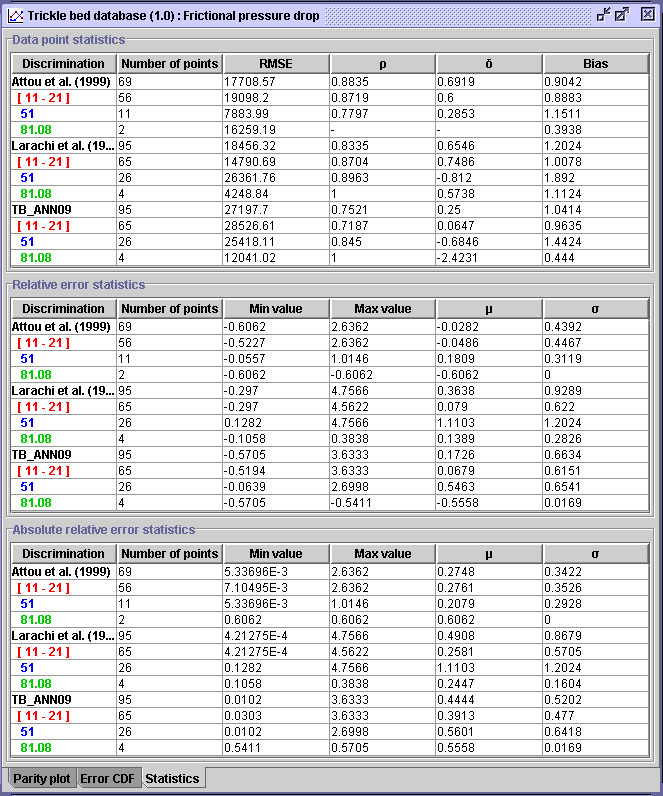 |
CONCLUSION #3: Generally
speaking, the TB_ANN09 correlation presents good predicting capability
for pressure 51 bars with an AARE of 56%. The Larachi et al.
(1991) correlation predicting frictional pressure drop is best for
operating pressures of 10-20 bars, while for cases reaching pressures higher
than 50 bars either of them can be used depending on the criteria used
: Absolute Relative Error (![]() )
or standard deviation (
)
or standard deviation (![]() )
)
| Multi_R_Designer Tutorial |