| Multi_R_Designer Tutorial |
Problem statement: The user looks for total pressure drop data in the integrated databank for which the following operating conditions are achieved.
1) Start a new project by selecting the Start new queryTemperature: superior than 273 K
Pressure: 10-100 bars
Liquid superficial velocity: 10 mm/s +/- 10% (or 9-11 mm/s)
Gas superficial velocity: inferior to 0.1 m/s
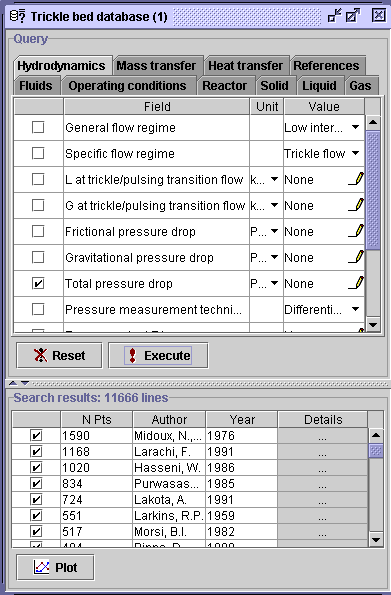
2) From the Database:Trickle bed (1) panel, select the Hydrodynamics tab. Check the box corresponding to Total pressure drop, and press the Execute button. The experimental data concerning total pressure drop will be extracted from the databank and presented in the Search results listing (11666 experimental measurements were extracted).
Comment: When there is no values recorded in the Value field "none", Multi_R_Designer does not assign any specifications and will automatically extract all experimental data dealing with the selected parameter.
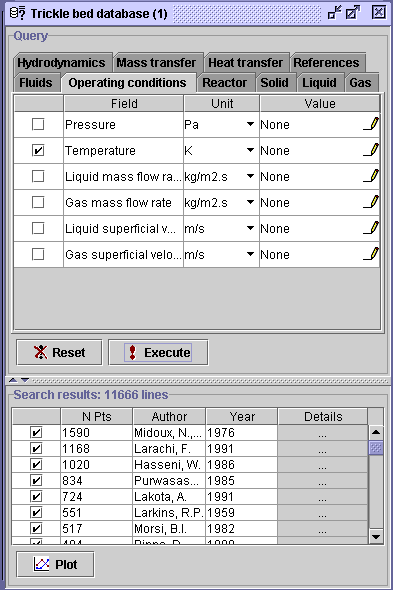
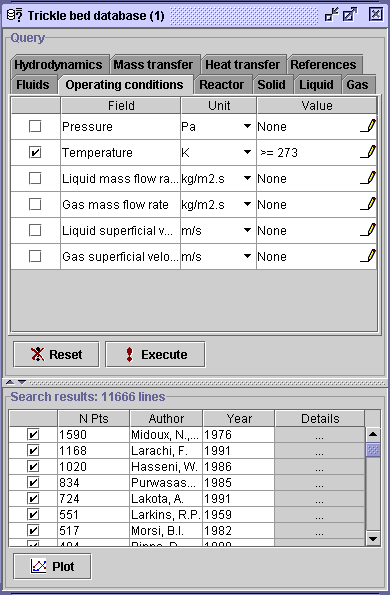
3) Select the Operating conditions tab. Check the box,
and then the
Value field option ![]() corresponding to the Temperature field. A new dialog window will
appear.
corresponding to the Temperature field. A new dialog window will
appear.
aa
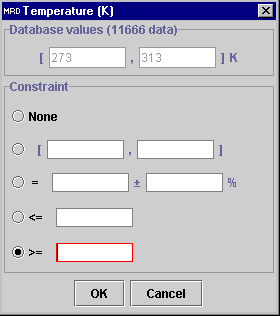
4) The Temperature dialog window contains the minimum
and maximum temperature values for the 11666data sets (273-313
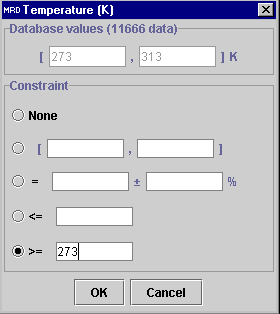
K). To fulfill the temperature constraint, check the (>=) option
and write
273 in the corresponding box. Press OK, then Execute.
Comment: Since this value (273 K) is equal to the
minimum value, the discrimination on temperature will not reduce the actual
list.
 |
 |
 |
 |
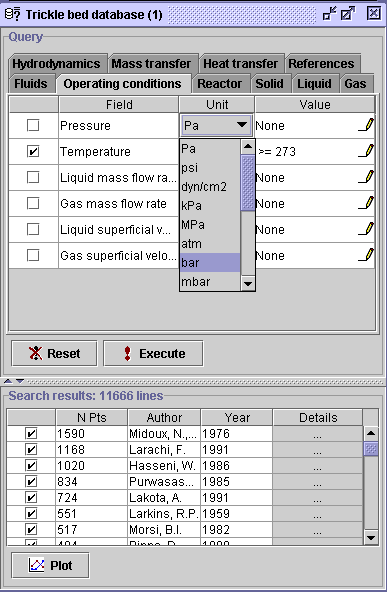
5) In the Operating conditions tab, check the Pressure
box option. In order to work in Bars instead of Pascals,
press the arrow![]() in the unit field. A choice of pressure units is presented to the user.
Choose the bar option, and the subsequent pressure values will be
transformed in bars. Then, select the Value pen
in the unit field. A choice of pressure units is presented to the user.
Choose the bar option, and the subsequent pressure values will be
transformed in bars. Then, select the Value pen ![]() corresponding to the Pressure field.
corresponding to the Pressure field.
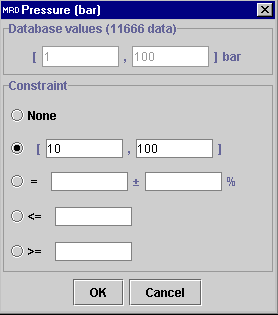
6) Similarly to the temperature case, the Pressure dialog
window contains the range values for the 11666 data sets (1-100
bar). To fulfill the pressure specification, check the bracket [,]
option and write
10 in the left box, 100 in the right box.
Press OK, then Execute. It will reduce the Search results
list to
1948 data sets from 7 publications.
 |
 |
 |
 |
7) In the Operating conditions tab, check the Liquid
superficial velocity box. To work in mm/s instead of the default
unit m/s, press the arrow![]() in the unit field. Choose the mm/s option. Select the Value
field pen
in the unit field. Choose the mm/s option. Select the Value
field pen ![]() corresponding to the Liquid superficial velocity field.
corresponding to the Liquid superficial velocity field.
8) In the Liquid superficial velocity dialog window, check
the (=) option and write 10 +/- 10% mm/s. Press OK,
then Execute. The Search results list contains now 209
data sets from 4 publications.
 |
 |
9) For the last specification, still in the Operating conditions
tab, check the Gas superficial velocity box option, and the Value
field option ![]() .
In the Gas superficial velocity dialog window, check the (<=)
option and write 0.1 in the corresponding box. Press
OK,
then Execute. The final Search results listing regroups 169
data sets fulfilling all specifications mentioned in the problem statement.
.
In the Gas superficial velocity dialog window, check the (<=)
option and write 0.1 in the corresponding box. Press
OK,
then Execute. The final Search results listing regroups 169
data sets fulfilling all specifications mentioned in the problem statement.
 |
 |
10) Save ![]() the actual project as Case problem I.mr in a folder of your
choice.
the actual project as Case problem I.mr in a folder of your
choice.
CONCLUSION: For further exploration, the user can represent any information related to the 169 data sets into different graphical form of his choice by activating the Plot creator.
| Multi_R_Designer Tutorial |