 |
 |
 |
Multi_R_Designer
Tutorial |
 |
 |
 |
aa
Sub-problem 2.4:
Establish an approximate total pressure drop value for nitrogen-water downflow
at 10 bars (1.3 mm glass beads; G=1 kg/m2s)
1) Open Case
problem I.mr.
2) Add the new specifications
to the problem.
-
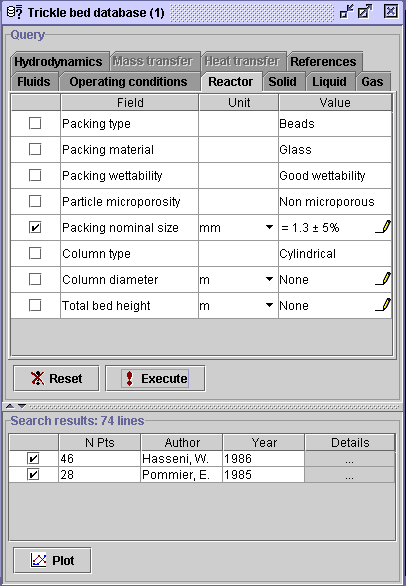
Select the Reactor tab. The qualitative
specifications on the Packing type and Packing material turn
insignificant since the choices have been reduced to Beads for the
Packing
type and Glass for the Packing material
(it means that
all 169 data sets deal with glass beads). This fact can be observed
when the combo box
 ,
which provides a list of components for the corresponding field, disappears.
-
Check the Packing nominal size
box, change the units from m to mm, and select the corresponding
Value
field
 .
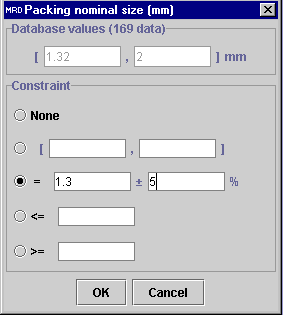
In the dialog window, write 1.3 in the left box with a 5%
extension in the right box. Press OK, then Execute. A total
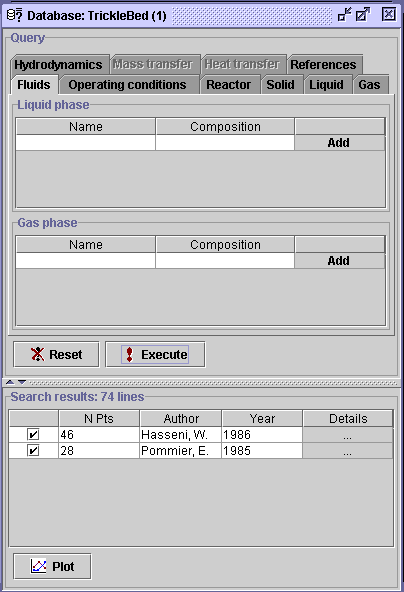
of 74 data sets remain in accordance within the problem specifications.
 |
 |
Select the Fluids tab to set
the liquid and gas compositions. The composition setup can be done using
two approaches, either from the liquid phase or gas phase point of view.
Select Add in the Liquid phase panel. The following dialog
window will be presented to the user. It exhibits all single components,
either a gas or liquid at room conditions, reported for the 74 data
sets. Select Water, highlighting it in blue, and press OK.
Do not execute.
Comment: When starting a new query, the user should always
specify the fluids composition at the end, if possible. Otherwise, the
component list for the whole integrated databank is rather long.
This is why a Search engine is provided based on four categories,
being the usual Name, the most common Synonym/ (or Name
if the synonym is not available), Acronym (if possible) and chemical
Formula
(if
possible).
-
The water and gas compositions remain
to be set. In the Liquid phase panel, select (unspecified)
in the Composition field
 .
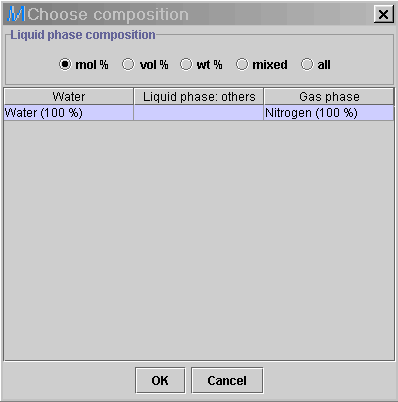
The ensuing dialog window gives the composition of water (Water)
in the liquid phase and the composition of other liquids (Liquid phase:
Others) as well. The last field gives the complete gas phase composition
(Gas phase). It looks that one gas/liquid combination involving
water is present for the reduced list (74 data sets). Highlight
the composition (Water - Water (100%); Gas phase -
Nitrogen
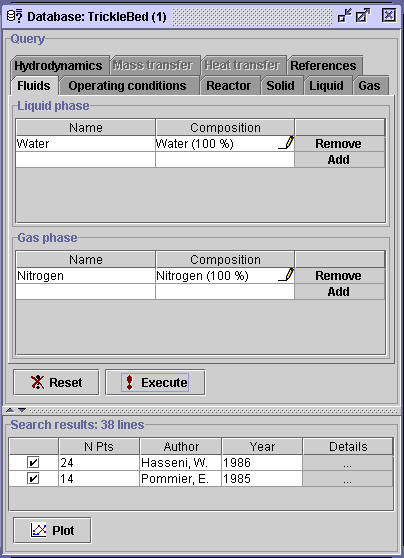
(100%), and press OK, then Execute. The list will be
reduced to 38 lines from Hasseni and Pommier.
 |
 |
Comment: After selecting a liquid, the user can highlight
one or several gas/liquid compositions in either one of the five tables
(mol. %, vol. %, wt %, mixed or all). The user can not select, for
example, one line from the mol. % table and another from the
vol.
% table. This is why the all table was formed, which contains
all compositions from the 4 previous tables. Go here
for a small example on how to use fluids composition table.
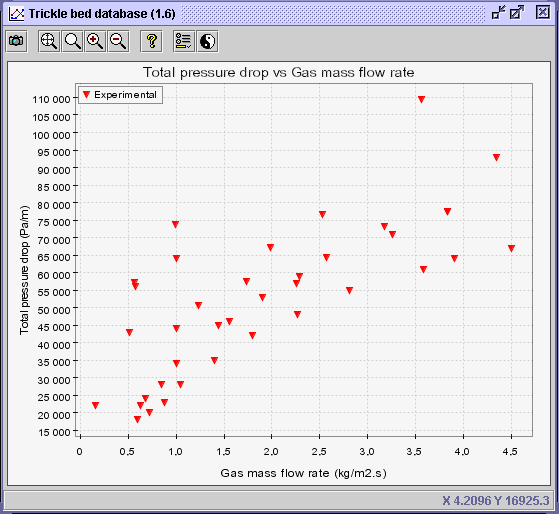
3) Select the Plot button  .
The Plot creator dialog window will appear.
a
4) To specify the X-axis
value, click on the knob corresponding to Operating conditions in
the Horizontal axis panel. Highlight Gas mass flow rate.
a
5) To specify the Y-axis
value, click on the knob corresponding to Hydrodynamics in the Vertical
axis panel. Click on the knob corresponding to Total pressure drop,
and highlight Experimental.
a
6) To specify the discriminate
value, choose the Advanced tab. Click on the knob corresponding
to Operating conditions, and select Pressure. Press
OK.
7) To discriminate the diagram
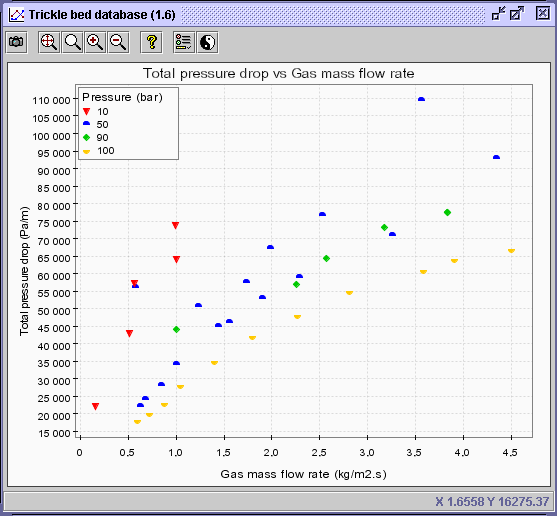
in terms of pressure, select the Discriminate series button  .
Choose the Value discrimination option. The minimum and maximum
values for the discriminate (pressure - 38 data sets) is presented
(Min value: 10 bar; Max value: 100 bar). Enter a large number
(i.e. 1000) in the Number of classes box. Press OK.
8) Lets say the diagram contains
thousands of points, making it difficult to perceive individual points
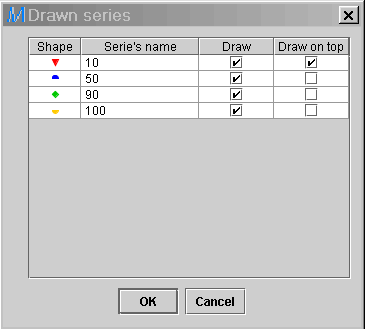
of interest. It is possible to draw only specific series in order to alleviate
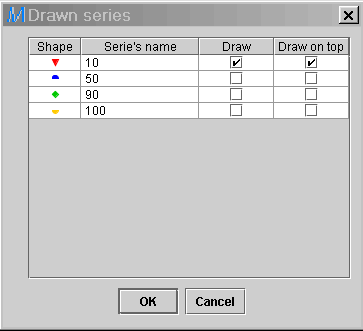
the diagram. For that matter, right click on the legend. The following
dialog window will be presented to the user. Unselect all the series in
the Draw field, except the one of interest (10 bar). Press
OK,
and all series for
50, 90 and 100 bar will be removed
from the diagram, but still in memory.
Comment: The Draw on top option enables the user
to draw the specified serie over the others. It is especially handful when
the diagram contains several data points. This option will be used in a
later example.
9) Save this problem  as Case problem 2.4.mr in a folder of your choice.
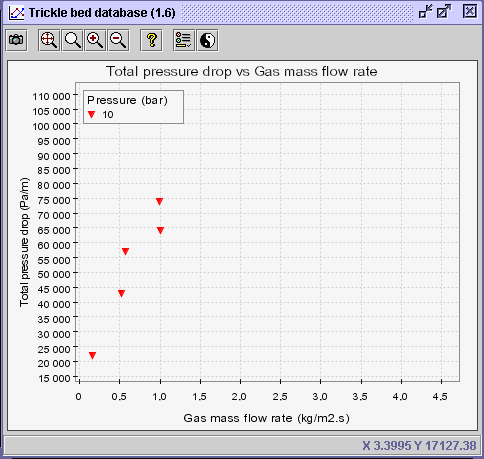
CONCLUSION: Based on the latter diagram, it can
be concluded that the total pressure drop for nitrogen-water downflow at
a gas mass flow rate approaching 1 kg/m2s through 1.3 mm glass
beads operated at 10 bars should approximate 70000 Pa/m or
70
kPa/m.
 |
 |
 |
Multi_R_Designer
Tutorial |
 |
 |
 |




![]() .
The Plot creator dialog window will appear.
.
The Plot creator dialog window will appear.
![]() .
Choose the Value discrimination option. The minimum and maximum
values for the discriminate (pressure - 38 data sets) is presented
(Min value: 10 bar; Max value: 100 bar). Enter a large number
(i.e. 1000) in the Number of classes box. Press OK.
.
Choose the Value discrimination option. The minimum and maximum
values for the discriminate (pressure - 38 data sets) is presented
(Min value: 10 bar; Max value: 100 bar). Enter a large number
(i.e. 1000) in the Number of classes box. Press OK.
![]() as Case problem 2.4.mr in a folder of your choice.
as Case problem 2.4.mr in a folder of your choice.