 |
 |
 |
Multi_R_Designer
Tutorial |
 |
 |
 |
AA
Sub-problem 2.3: Total
pressure drop vs. gas superficial velocity (discriminate: pressure) for
L = 10 +/- 1% kg/m2s
1) Open Case
problem I.mr.
-
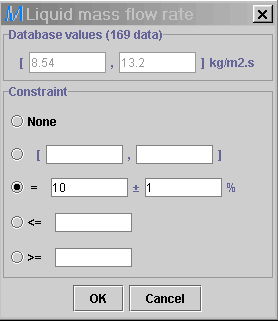
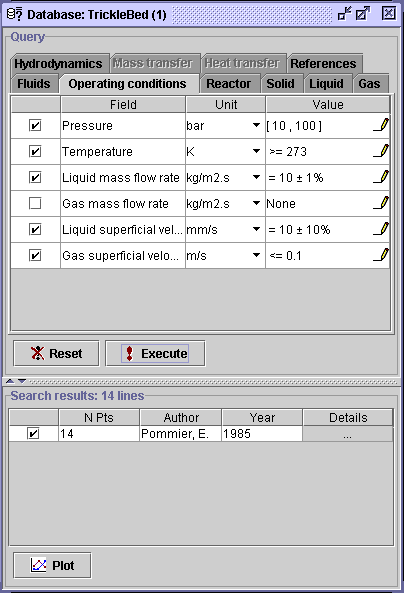
Add the new specifications to the problem.
Check the Liquid mass flow rate box, and select the corresponding
Value
field
 to enter the dialog window. Write 10 in the left box and 10 in
the right box. Press OK, then Execute. Fourteen (14)
data sets from Pommier, 1985 remain in the Search results
table.
2) Select the Plot button  .
The Plot creator dialog window will appear.
aa
3) To specify the X-axis
value, click on the knob corresponding to Operating conditions in
the Horizontal axis panel. Highlight Gas superficial velocity.
a
4) To specify the Y-axis
value, click on the knob corresponding to Hydrodynamics in the Vertical
axis panel. Click on the knob corresponding to Frictional pressure
drop, and highlight Experimental.
a
5) To specify the discriminate
value, choose the Advanced tab. Click on the knob corresponding
to Operating conditions, and select Pressure. Press OK.
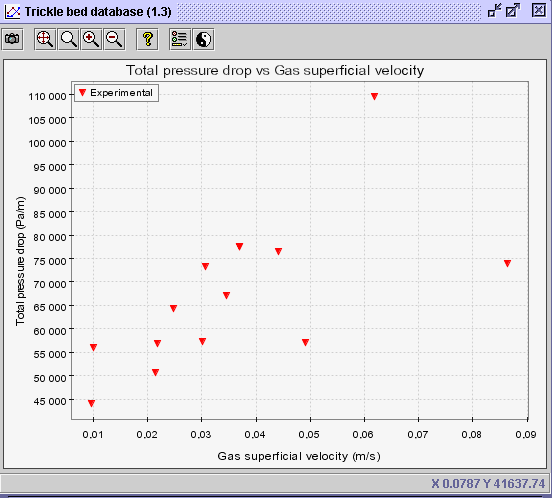 |
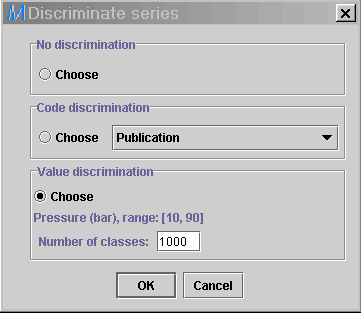
6) To discriminate the diagram
in terms of pressure, select the Discriminate series icon  .
In the dialog window, choose the
Value discrimination option.
The minimum and maximum values for the discriminate (pressure - 14 data
sets) is presented (Min value:
10
bars; Max value: 90 bars).
In order to discriminate the diagram into an infinite number of classes,
enter a large number (i.e. 1000). Hopefully, the series will represent
a single pressure instead of a range. Press OK. The following diagram
is obtained.
aa
Advice: Do not divide
the min-max range into a large number of classes for diagrams holding large
number of data. Otherwise, the legend will contain an exhausting inventory.
 |
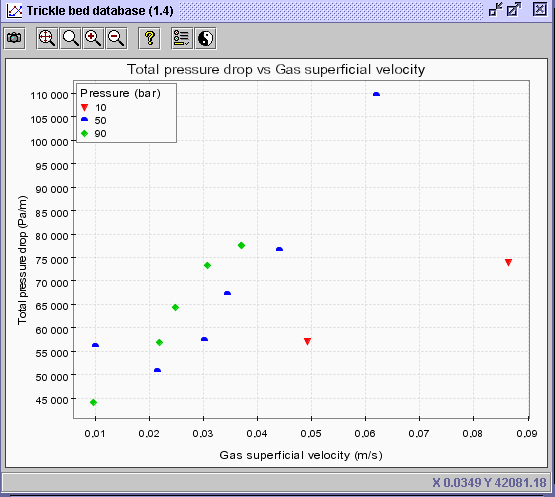 |
CONCLUSION: From the diagram point of view, it seems
that high pressure operation increases the total pressure drop. However,
one exception arises (blue point at X=0.01) which does not follow the general
trend. It suggests that some experimental results from the integrated
databank surely contain experimental errors and consequently, the data
must be scrutinized objectively by the user.
 |
 |
 |
Multi_R_Designer
Tutorial |
 |
 |
 |
![]() .
The Plot creator dialog window will appear.
.
The Plot creator dialog window will appear.

![]() .
In the dialog window, choose the
Value discrimination option.
The minimum and maximum values for the discriminate (pressure - 14 data
sets) is presented (Min value:
10
bars; Max value: 90 bars).
In order to discriminate the diagram into an infinite number of classes,
enter a large number (i.e. 1000). Hopefully, the series will represent
a single pressure instead of a range. Press OK. The following diagram
is obtained.
.
In the dialog window, choose the
Value discrimination option.
The minimum and maximum values for the discriminate (pressure - 14 data
sets) is presented (Min value:
10
bars; Max value: 90 bars).
In order to discriminate the diagram into an infinite number of classes,
enter a large number (i.e. 1000). Hopefully, the series will represent
a single pressure instead of a range. Press OK. The following diagram
is obtained.

