 |
 |
 |
Multi_R_Designer
Tutorial |
 |
 |
 |
AA
Sub-problem 2.2:
Frictional pressure drop vs. liquid mass flow rate (discriminate: liquid
composition)
1) After completing Case
problem I (if the project is closed, open it), select the Plot button  .
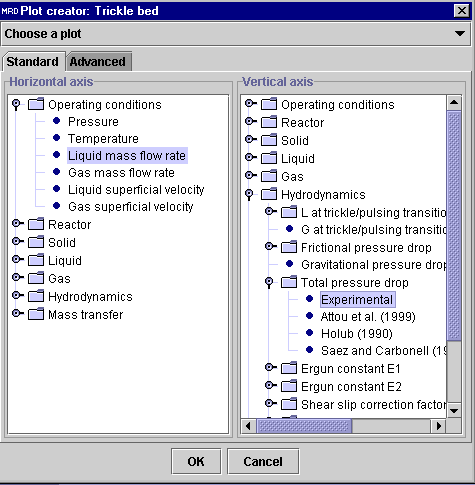
The Plot creator dialog window will appear.
aa
2) To specify the X-axis
value, click on the knob corresponding to Operating conditions in
the Horizontal axis panel. Select Liquid mass flow rate.
aa
3) To specify the Y-axis
value, click on the knob corresponding to Hydrodynamics in the Vertical
axis panel. Click on the knob corresponding to Frictional pressure
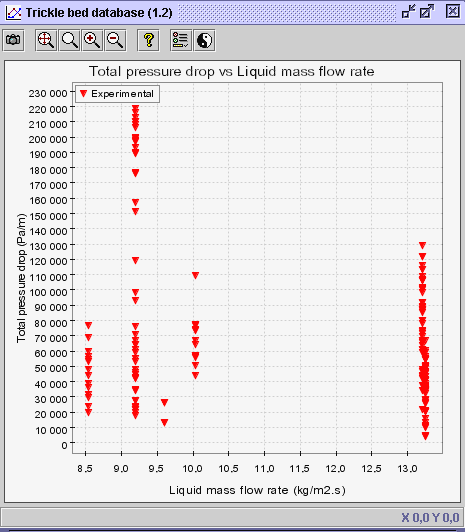
drop, and highlight Experimental. Press OK.
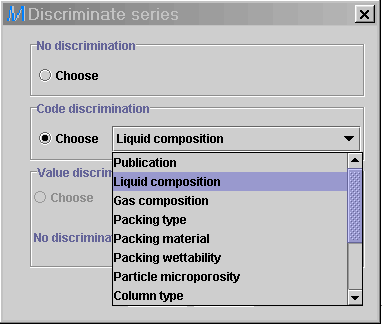
4) In order to discriminate
the diagram in terms of liquid compositions, select the Discriminate
series button  .
Choose the Code discrimination option (Code discrimination
includes information that are qualitative in nature, i.e. flow regimes,
packing type, gas/liquid compositions). In the combo box
 ,
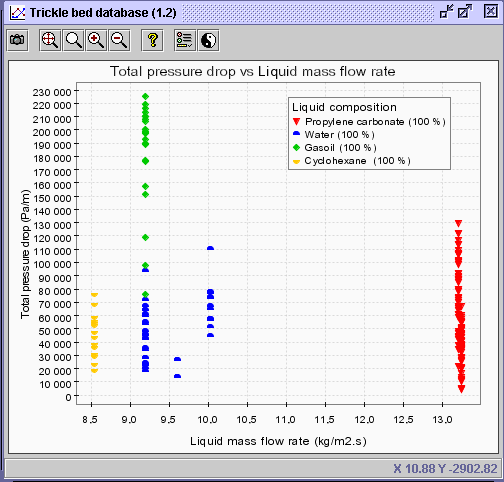
select Liquid composition. Press OK. The following diagram
is obtained.
CONCLUSION: A total of 4 liquid compositions, namely
100%
propylene carbonate, 100% water, 100% gasoil and
100%
cyclohexane have been recorded for the 169 data sets.
 |
 |
 |
Multi_R_Designer
Tutorial |
 |
 |
 |
![]() .
The Plot creator dialog window will appear.
.
The Plot creator dialog window will appear.


![]() .
Choose the Code discrimination option (Code discrimination
includes information that are qualitative in nature, i.e. flow regimes,
packing type, gas/liquid compositions). In the combo box
.
Choose the Code discrimination option (Code discrimination
includes information that are qualitative in nature, i.e. flow regimes,
packing type, gas/liquid compositions). In the combo box![]() ,
select Liquid composition. Press OK. The following diagram
is obtained.
,
select Liquid composition. Press OK. The following diagram
is obtained.

