| Multi_R_Designer Tutorial |
1) After completing Sub-problem 7.1, return to the Query index in the Fluids tab.
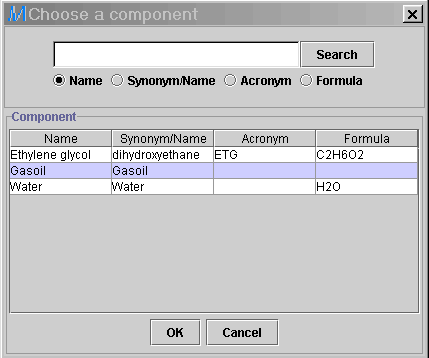
2) Press the Add button in the Liquid phase panel, and highlight Gasoil. Press OK.
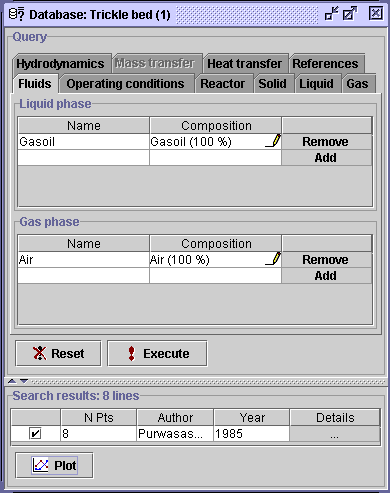
3) Select the (unspecified)![]() option in the Composition field. It shows that only one gas/liquid
composition involving gasoil in the liquid phase is repertoriated in the
restricted database containing 40 data sets. Press OK, then
Execute. Eight (8) data sets from Purwasasmita satisfies these conditions.
option in the Composition field. It shows that only one gas/liquid
composition involving gasoil in the liquid phase is repertoriated in the
restricted database containing 40 data sets. Press OK, then
Execute. Eight (8) data sets from Purwasasmita satisfies these conditions.
 |
 |
4) Select the Plot
button ![]() to open the plot creator.
to open the plot creator.
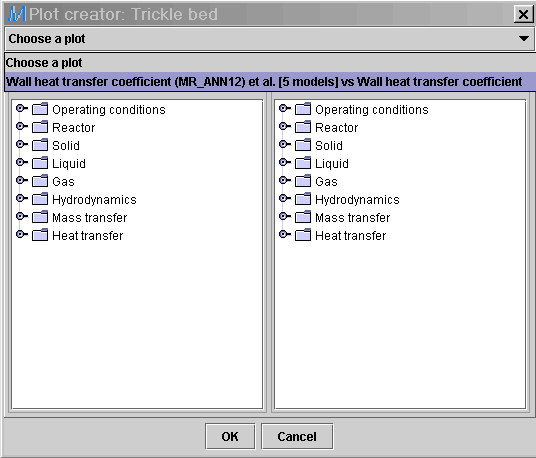
5) From the Choose a plot
combo box![]() ,
select the same diagram created in the previous sub-problem (Wall heat
transfer coefficient (MR_ANN12) et al. [5 models] vs Wall heat transfer
coefficient). In the Y-axis, the MR_ANN12 was the first selected
model amongst 5 models while the Wall heat transfer coefficient
experimental value was selected for the X-axis.
,
select the same diagram created in the previous sub-problem (Wall heat
transfer coefficient (MR_ANN12) et al. [5 models] vs Wall heat transfer
coefficient). In the Y-axis, the MR_ANN12 was the first selected
model amongst 5 models while the Wall heat transfer coefficient
experimental value was selected for the X-axis.
 |
 |
 |
 |
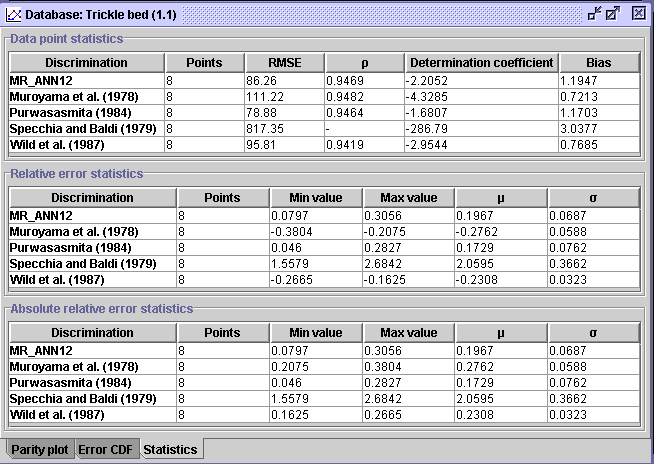 |
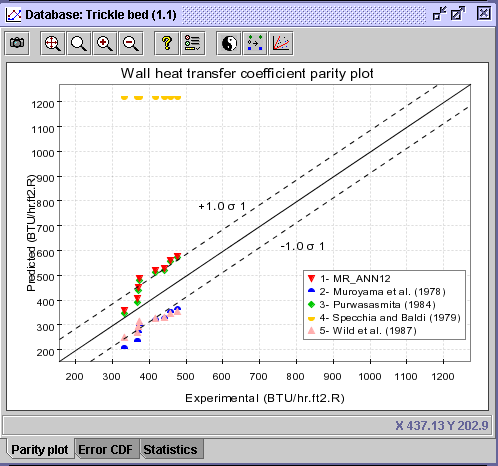
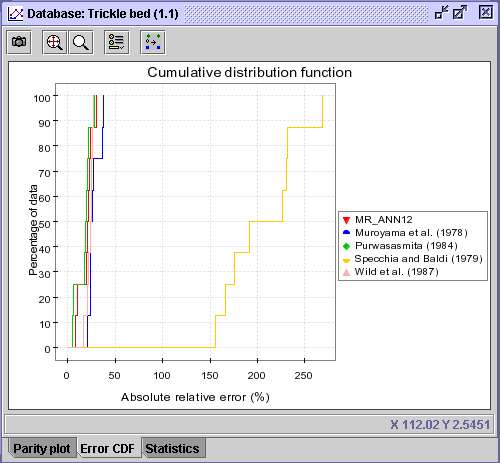
CONCLUSION: With the exception of the Specchia and Baldi (1979) correlation, the parity plot and CDF diagram do not exhibit much distinction between the correlations. Based on the statistics, thePurwasasmita (1984) and MR_ANN12 correlations can be considered the best correlations for predicting heat transfer coefficient at the reactor's wall between 100 and 500 BTU/hr/ft2/R for air/gasoil downflow through a bed of glass beads.
| Multi_R_Designer Tutorial |