| Multi_R_Designer Tutorial |
1) After completing Sub-problem 7.2, return to the Query index and the Fluids tab.
2) Remove the gas/liquid specifications by activating the Remove button associated with Gasoil in the Liquid phase panel. Execute (40 data sets should be recovered).
3) Select the Plot
button ![]() to enable the plot creator.
to enable the plot creator.
4) In the Horizontal axis panel (Standard tab), click on the knob corresponding to Operating conditions and highlight Pressure.
5) In the Vertical axis panel, click on the knob corresponding to Heat transfer, then Wall heat transfer coefficient. Try to select Experimental and MR_ANN12. For security reasons, the option of drawing experimental values with correlation predictions on the same axis is not allowed.
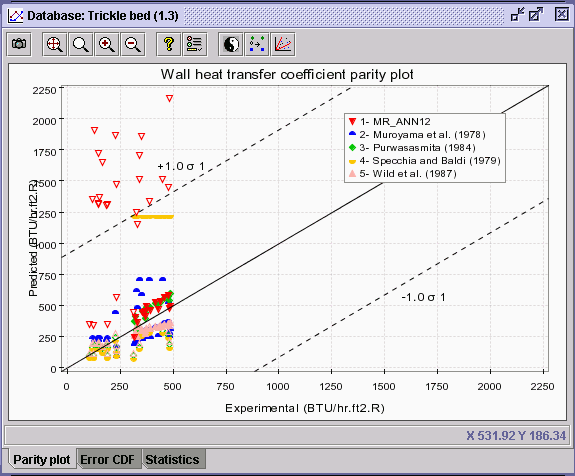
6) Therefore, return to the Horizontal axis panel, and highlight Experimental in the Heat transfer: Wall heat transfer coefficient folder. In Vertical axis panel, select the 5 correlations for wall heat transfer coefficient predictions.
7) In the Advanced
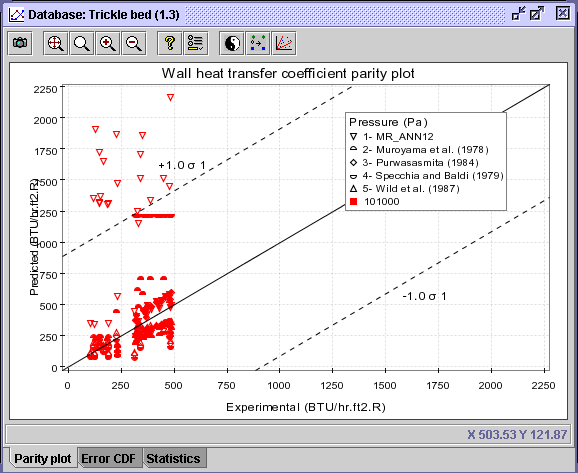
tab, select Pressure in the Operating conditions folder as
the discriminate parameter. Press OK.
 |
8) Select the Discriminate
series ![]() icon. Choose the Value discrimination option for pressure discrimination
and write 100 in the Number of classes entry. Press OK.
icon. Choose the Value discrimination option for pressure discrimination
and write 100 in the Number of classes entry. Press OK.
 |
CONCLUSION: As shown on the parity plot, the 40 experimental values on wall heat transfer coefficients extracted from the query is ascribed to operating pressures of 101000 Pa or ca. 1 atm. Consequently with the present information available, it can not be determined which correlation predicts the best hw for operating pressures of 10 atm.
| Multi_R_Designer Tutorial |