| Multi_R_Designer Tutorial |
Problem statement: After creating a user database as explained in the Simulating with MRD section, compare the proprietary data with the integrated databank for total pressure drop based on the following specifications.
1) After completing the tutorial section (Creation of a user database from a file), start a new queryPressure: 80-90 atm
Packing type: 1-3 mm glass beads
Liquid mass flow rate: 10 kg/m2s +/- 10% (or 9-11 kg/m2s)
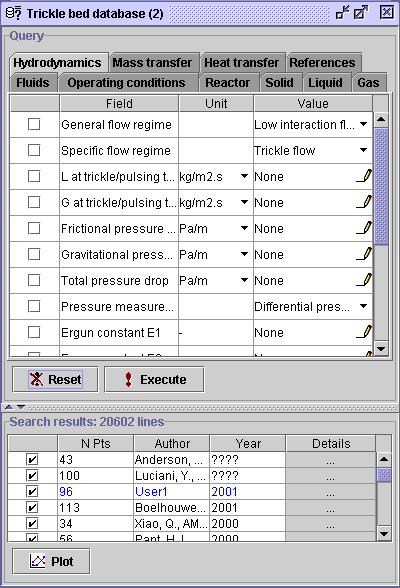
2) Activate twice the Year heading in the Search results
panel. The User1 database appears at the top of the list and is
marked in blue.
 |
3) Select the Hydrodynamics tab. Since the User1 database deals exclusively with frictional pressure drop, check the box corresponding to Total pressure drop, and press Execute. The experimental data on frictional pressure drop will be extracted from the databank and User1 database (11762 experimental measurements were extracted).
4) Select the Operating conditions tab. Check the box
corresponding to the Pressure field and change the units from Pa
to atm. Then, activate the
Value field ![]() dialog window.
dialog window.
aa
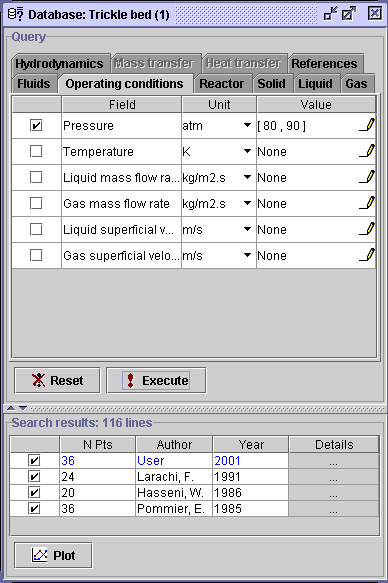
5) The Pressure dialog window contains the minimum and
maximum pressure values for the 11762 data sets (0.987-98.7 atm).
To fulfill the pressure constraint, check the [,] option, write
80 in the left box and 90 in the right box. Press OK, then
Execute.
116
data sets were extracted.
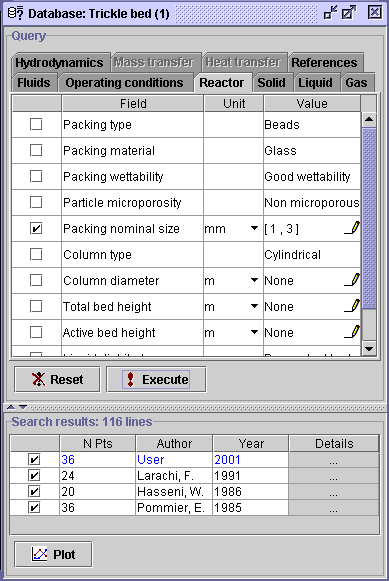
6) Select the Reactor tab. Note that all experimental
measurement for the restricted database are carried out with glass beads.
Hence, it is not necessary to specify the packing type and packing material.
Check the box corresponding to Packing nominal size, change the
units for mm and enter the dialog window ![]() .
Check the [,] option, write 1 in the left box and 3 in
the right box. Press OK, then Execute. The specification
has no effect since the min-max range for the 116 data sets is actually
1.32-2
mm.
.
Check the [,] option, write 1 in the left box and 3 in
the right box. Press OK, then Execute. The specification
has no effect since the min-max range for the 116 data sets is actually
1.32-2
mm.
 |
 |
7) For the final specification, enter the Operating conditions
tab and check the Liquid mass flow rate box option. Then, select
the Value pen ![]() corresponding to the same field. To fulfill the specification, check the
(=)
option
and write
10 in the left box, 10 in the right box. Press
OK,
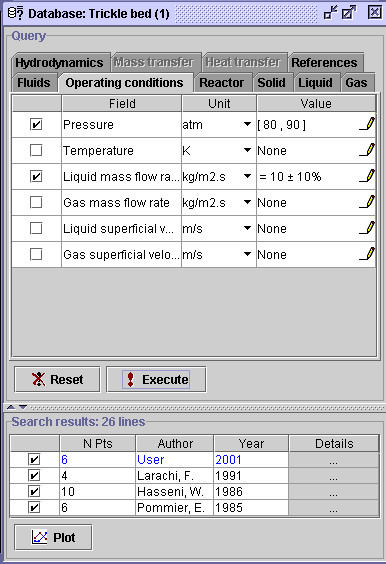
then Execute. The final list contains 26 data sets from
Larachi
(1991), Hasseni (1986), Pommier (1985) and the User
database (2001). Since we do not own any proprietary data, we used,
as an example, the Pommier (1985) publication for the composition of the
User1
database. Therefore, the data from
User and
Pommier (1985)
are exactly the same. To continue the analysis, unselect the
6 Pommier
(1985) data sets in order to put it aside during the plot creation.
corresponding to the same field. To fulfill the specification, check the
(=)
option
and write
10 in the left box, 10 in the right box. Press
OK,
then Execute. The final list contains 26 data sets from
Larachi
(1991), Hasseni (1986), Pommier (1985) and the User
database (2001). Since we do not own any proprietary data, we used,
as an example, the Pommier (1985) publication for the composition of the
User1
database. Therefore, the data from
User and
Pommier (1985)
are exactly the same. To continue the analysis, unselect the
6 Pommier
(1985) data sets in order to put it aside during the plot creation.
 |
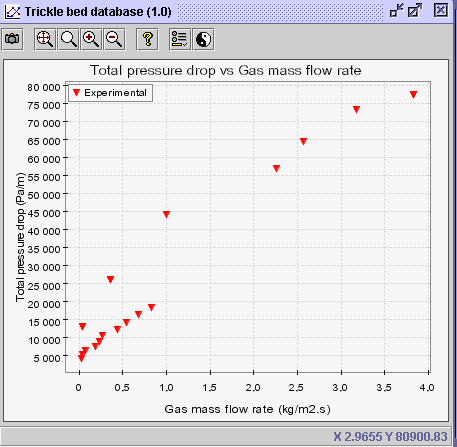
8) After doing so, activate the plot creator ![]() .
Choose gas mass flow rate (Operating conditions: Gas mass flow rate)
in
the Horizontal axis panel and frictional pressure drop (Hydrodynamics:
Total pressure drop: Experimental) in the Vertical axis panel.
In the Advanced tab, select pressure as the discriminate
(Operating
conditions: Pressure). Press OK.
.
Choose gas mass flow rate (Operating conditions: Gas mass flow rate)
in
the Horizontal axis panel and frictional pressure drop (Hydrodynamics:
Total pressure drop: Experimental) in the Vertical axis panel.
In the Advanced tab, select pressure as the discriminate
(Operating
conditions: Pressure). Press OK.
9) Activate the Discriminate series button ![]() and write a large number (i.e. 100) in the Number of classes entry
(Value discrimination option). Press OK.
and write a large number (i.e. 100) in the Number of classes entry
(Value discrimination option). Press OK.
 |
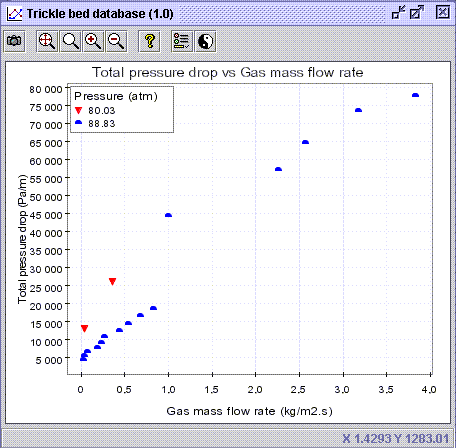 |
CONCLUSION #1: Based on the actual data points, it seems that pressure drop follows a somewhat linear trend with the gas mass flow rate for 1-3 mm glass beads at pressures up to 80-90 atm.
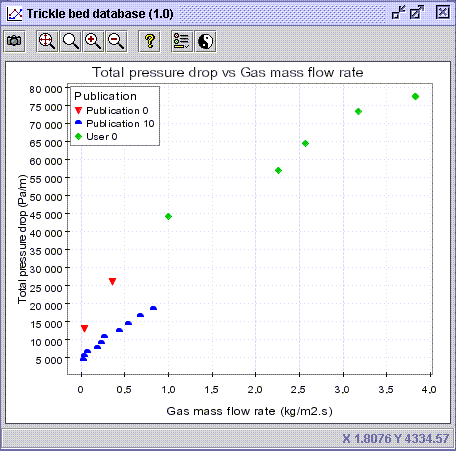
10) Activate again the Discrimination serie button ![]() and choose Publication from the list in the Code discrimination
section. Press OK. It shows that the 88.83 atm experiments were
extracted from Publication 10 (Hasseni) and the first user database
(User 0) introduced in Multi_R_Designer.
and choose Publication from the list in the Code discrimination
section. Press OK. It shows that the 88.83 atm experiments were
extracted from Publication 10 (Hasseni) and the first user database
(User 0) introduced in Multi_R_Designer.
11) Close the actual diagram and re-activate the plot creator ![]() .
Choose gas mass flow rate (Operating conditions: Gas mass flow rate)
in
the Horizontal axis panel and frictional pressure drop (Hydrodynamics:Total
pressure drop: Experimental) in the Vertical axis panel. In
the Advanced tab, select Packing nominal size as the discriminate
(Reactor:
Packing nominal size). Press OK.
.
Choose gas mass flow rate (Operating conditions: Gas mass flow rate)
in
the Horizontal axis panel and frictional pressure drop (Hydrodynamics:Total
pressure drop: Experimental) in the Vertical axis panel. In
the Advanced tab, select Packing nominal size as the discriminate
(Reactor:
Packing nominal size). Press OK.
12) Activate the Discriminate series button ![]() and write a large number (i.e. 10) in the Number of classes entry
(Value discrimination option). Press OK.
and write a large number (i.e. 10) in the Number of classes entry
(Value discrimination option). Press OK.
 |
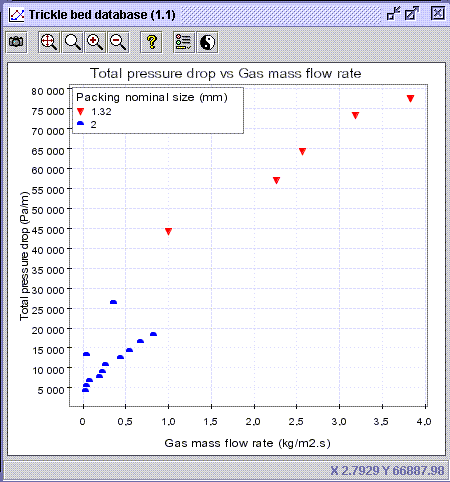 |
CONCLUSION #2: With the same operating pressure, it looks like smaller packing size (i.e. 1.32 mm) increases the pressure drop. Even though the difference between the 2 packing size is marginal, the extension of the lower blue dots trend towards higher gas mass flow rate would clearly appear below the red dots.
| Multi_R_Designer Tutorial |