 |
 |
 |
Multi_R_Designer
Tutorial |
 |
 |
 |
aa
Sub-problem 5.2:
General trend for hw in function of liquid mass flow rate at
liquid viscosity of 13 lb/ft/hr
1) After completing Sub-problem
5.1, reduce the diagram window (Do not close it - it will be printed
later) and return to the Query index.
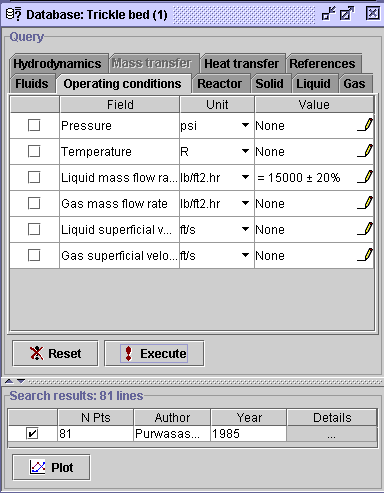
2) In the Operating conditions
tab, unselect the box corresponding to Liquid mass flow rate and
Execute.
The
Search
results list will increase to 81 data sets (N.B. it is not necessary
to substitute 15000 +/- 20% for 'none' in the Value field).
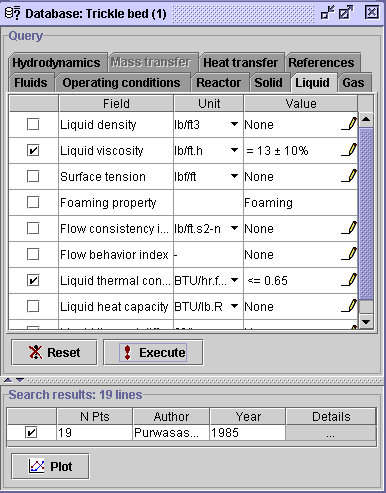
3) In the Liquid tab,
check the box corresponding to Liquid viscosity and enter the Value
field  dialog window. With a min-max range of 2.1-37.0 lb/ft/hr, write
13
+/- 10% extension in the corresponding boxes. Press
OK,
then Execute. Nineteen (19) data sets are extracted.
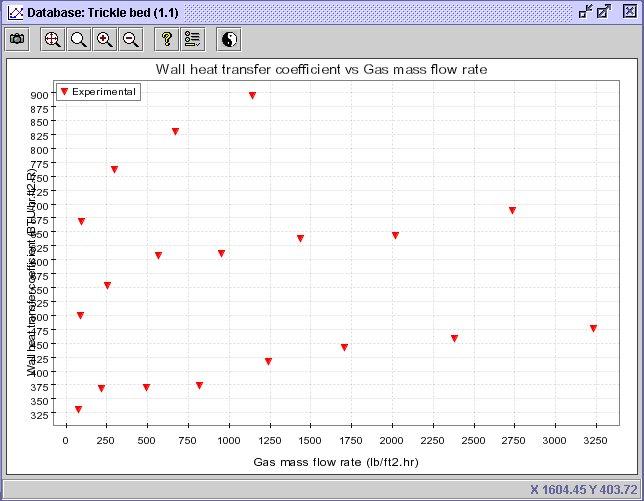
4) Select the Plot
button  .
In the Horizontal axis panel, choose Gas mass flow rate (Operating
conditions: Gas mass flow rate). In the Vertical axis panel,
choose Experimental (Heat transfer: Wall heat transfer coefficient:
Experimental). In the Advanced panel, select
Liquid mass
flow rate (Operating conditions: Liquid mass flow rate) as the discriminate
value. Press OK. The following diagram is created.
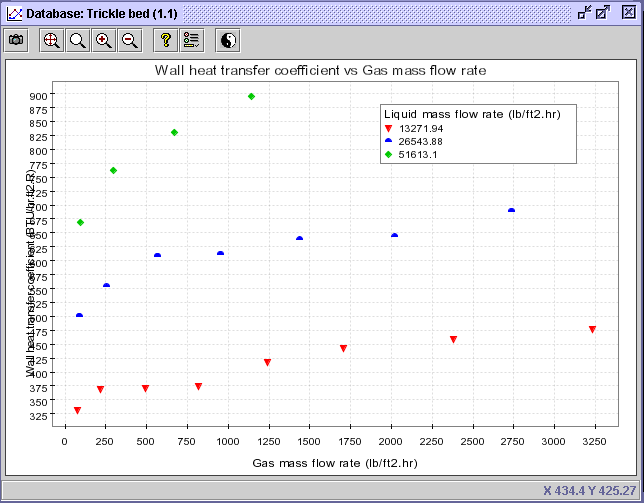
5) Select the Discriminate
series button  and check the Value discrimination option. Write 10 in the
Number
of classes entry. Press OK.
CONCLUSION: The diagram corroborates the fact that greater
liquid mass flow rate and gas mass flow rate promotes the heat transfer
potential at the wall. This is the case for Purwasasmita's data using glass
beads and a liquid having a viscosity of ca. 13 lb/ft/hr. For more
information on the liquid composition, use Liquid composition in
the Code discrimination listing .
Press OK. The following diagram informs that pure gasoil was used
as the liquid for this particular case.
 |
 |
 |
Multi_R_Designer
Tutorial |
 |
 |
 |
![]() dialog window. With a min-max range of 2.1-37.0 lb/ft/hr, write
13
+/- 10% extension in the corresponding boxes. Press
OK,
then Execute. Nineteen (19) data sets are extracted.
dialog window. With a min-max range of 2.1-37.0 lb/ft/hr, write
13
+/- 10% extension in the corresponding boxes. Press
OK,
then Execute. Nineteen (19) data sets are extracted.


![]() .
In the Horizontal axis panel, choose Gas mass flow rate (Operating
conditions: Gas mass flow rate). In the Vertical axis panel,
choose Experimental (Heat transfer: Wall heat transfer coefficient:
Experimental). In the Advanced panel, select
Liquid mass
flow rate (Operating conditions: Liquid mass flow rate) as the discriminate
value. Press OK. The following diagram is created.
.
In the Horizontal axis panel, choose Gas mass flow rate (Operating
conditions: Gas mass flow rate). In the Vertical axis panel,
choose Experimental (Heat transfer: Wall heat transfer coefficient:
Experimental). In the Advanced panel, select
Liquid mass
flow rate (Operating conditions: Liquid mass flow rate) as the discriminate
value. Press OK. The following diagram is created.

![]() and check the Value discrimination option. Write 10 in the
Number
of classes entry. Press OK.
and check the Value discrimination option. Write 10 in the
Number
of classes entry. Press OK.

