 |
 |
 |
Multi_R_Designer
Tutorial |
 |
 |
 |
AA
Sub-problem 4.1:
Observations on kLa in function of liquid viscosity for a liquid
mass flow rate of 5 kg/m2s.
1) Start a new project by
selecting Start new query  .
.
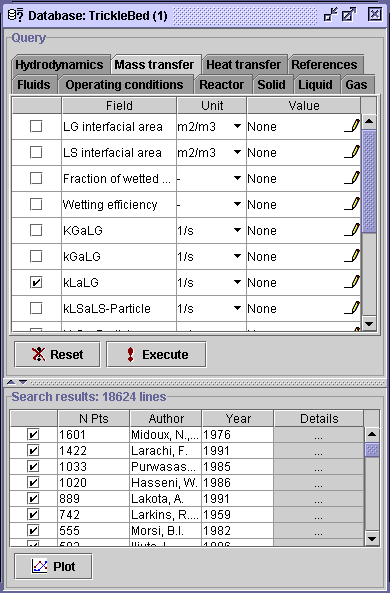
2) Apply the following problem
specifications, namely the Experimental technique: Physical absorption,
Liquid viscosity: values between 2 and 30 cP and Liquid mass flow
rate: 5 kg/m 2s.
First, select the Mass transfer
tab and check the box related to kLaLG, then
Execute.
It will extract 882 data sets containing kLa values.
Comment: Notice that
a large number of fields in the Mass transfer tab disappears after
executing. When no corresponding values or information are found in the
restricted database (882 data sets), the fields are hidden from
view (i.e. there is no interfacial area values associated with the kLa
values). It avoids selecting fields which would inevitably result in an
empty Search results.
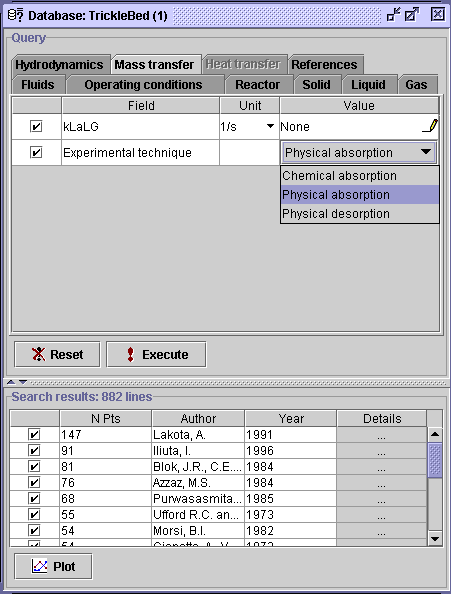
Check the Experimental technique
box in the Mass transfer tab and select Physical absorption from
the restricted list and Execute. Consequently, it is found that
4 authors combined for 326 data sets have measured liquid-side mass
transfer coefficients (kLa) associated to a physical absorption
process.
-
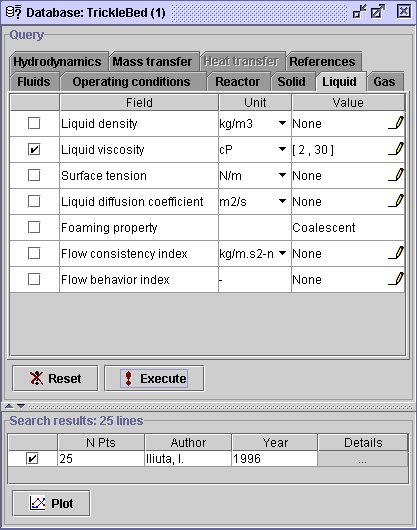
In the Liquid tab, check the
Liquid
viscosity box and change the corresponding units from Pa.s to
cP.
Click on the corresponding Value field
 .
The new dialog window denotes the minimum-to-maximum range for the 326
data sets (0.868 - 23.4 cP). To fulfill the problem specifications,
enter 2 cP and 30 cP in the appropriate boxes. Press OK,
then
Execute. A total of 25 data sets from Iliuta (1996) are extracted.
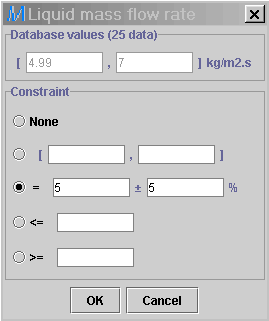
The last specification involves the
Liquid
mass flow rate in the Operating conditions tab. Select the Value
field  for this parameter. The following window dialog notifies that the liquid
mass flow rate for the 25 data sets varies between 4.99 and
7
kg/m2s. Write 5 +/- 0% in the corresponding boxes.
Press OK.
Comment: Even though
5 kg/m2s is enclosed within the min-max boundaries, there is
no liquid mass flow rates in the restricted database (25 data sets)
that were recorded exactly as 5.00 kg/m2s. The Warning
message (Search result empty with this entry) informs the user that
an empty search results would be obtained with the actual entry and demands
the user to re-specify it.
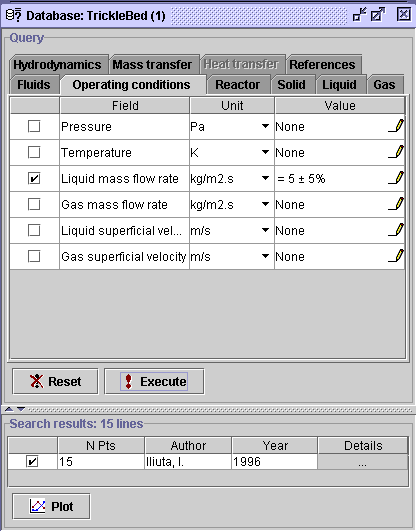
Consequently, write 5 +/- 5%
to include the min value (4.99 kg/m2s). Press OK, then
Execute.
The final Search results list contains 15
lines.
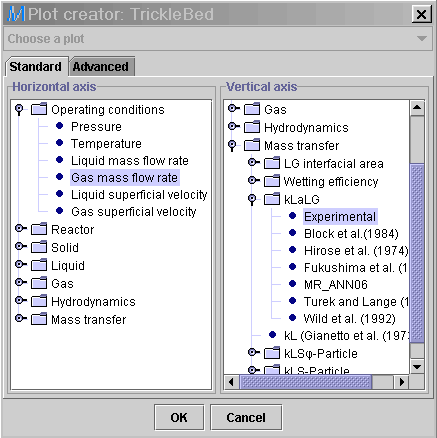
3) Select the Plot
button  .
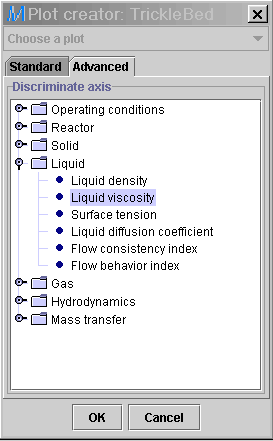
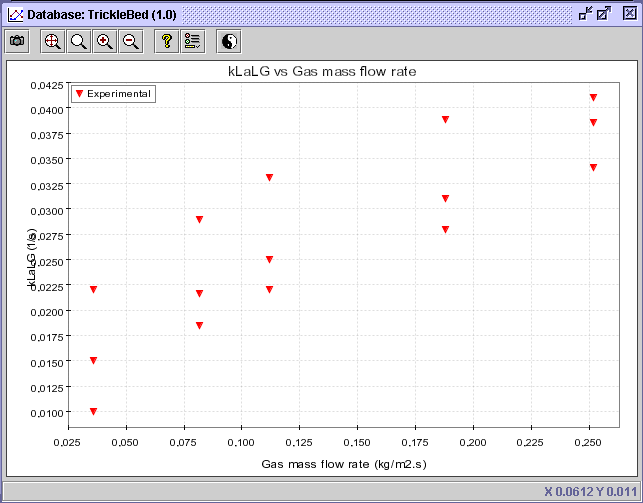
Choose Gas mass flow rate (Operating conditions: Gas mass flow
rate) in the Horizontal axis panel and Experimental (Mass
transfer: kLaLG: Experimental) in the Vertical
axis panel.
4) In the Advanced
tab, select Liquid viscosity (Liquid: Liquid viscosity) as
the discriminate value. Press OK.
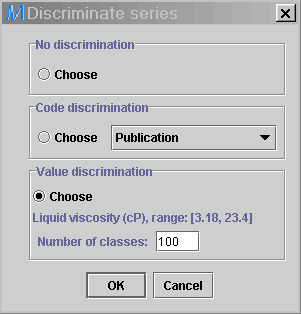
5) Select the Discriminate
series button  and choose the Value discrimination option. Write 100 in
the Number of classes box to create 100 equally divided series between
3.18
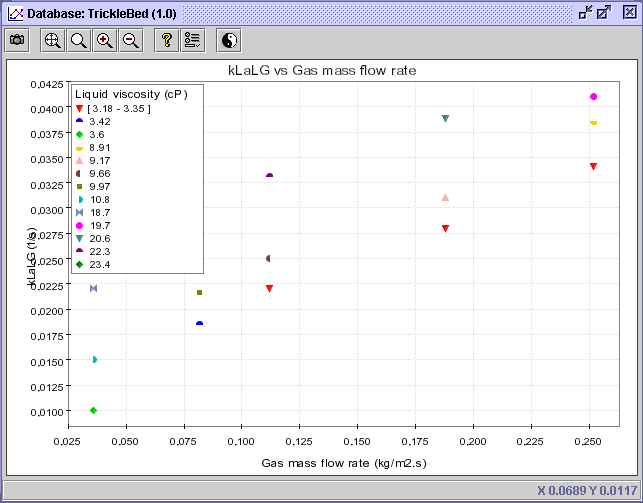
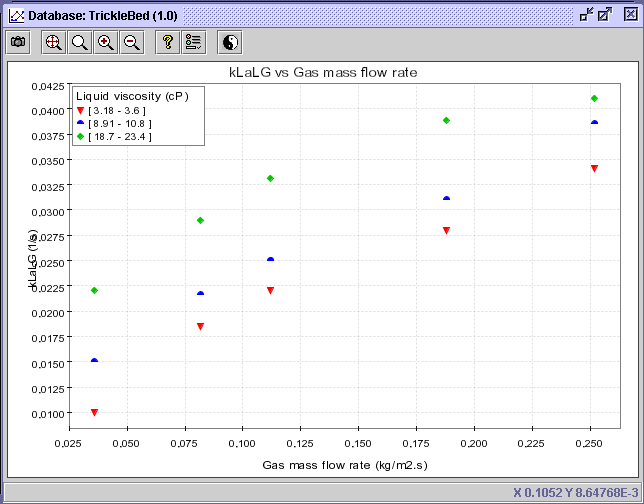
and 23.4 cP. Press OK. The diagram is effectively divided
into 13 series. However, the observation of a persisting trend remains
difficult. Instead, the liquid viscosity should be divided in 3 equally
spaced series since 3 definite liquid viscosity clusters are covered in
the legend (1: 3.18-3.6 cP; 2: 8.91-10.8 cP; 3: 18.7-23.4
cP). Return to the
Discriminate series dialog window
  and change 13 for 4 (By trial and error, 4 equally divided
series gives a better diagram).
CONCLUSION #1: Based on the latter diagram, it
becomes clear that greater liquid viscosity up to 25 cP increases invariably
the liquid-side mass transfer coefficient (kLa). For example,
at G = 0.035 kg/m2s, k La increases with liquid viscosity
at a proportion close to 0.0008 s -1/cP and lowers at G = 0.185
kg/m2s with a proportion of ca. 0.0006 s-1/cP.
The next step would be to verify that the 15 data sets showcased
in the diagram are really representative of the liquid viscosity influence
on kLa and do not involve any other factors which were not defined
in the query. These factors could be different packing type, packing material
or liquid distributor for example.
6) To verify this matter,
select the Discriminate series button  and choose the Code discrimination option. Select first the
Packing
type option from the combo list
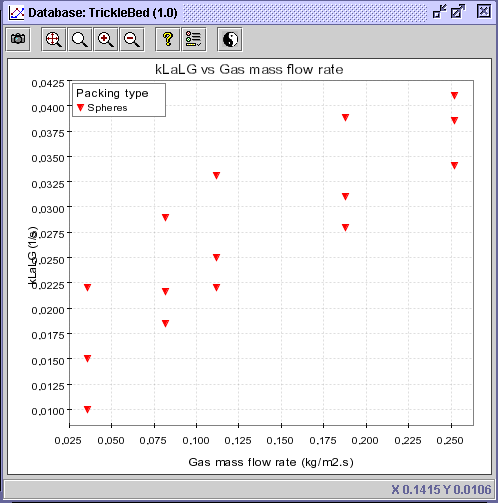
  and press OK. It shows that all 15 experiments were carried
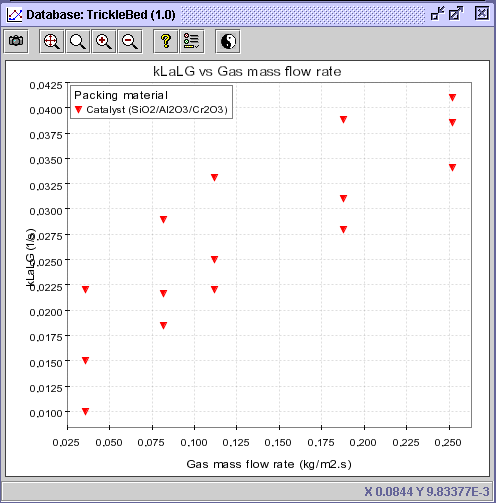
out with a spherical packing. Secondly, select the Packing material
option and press OK. A single packing material, namely SiO
2/Al2O3/Cr2O3 catalyst
material was used.
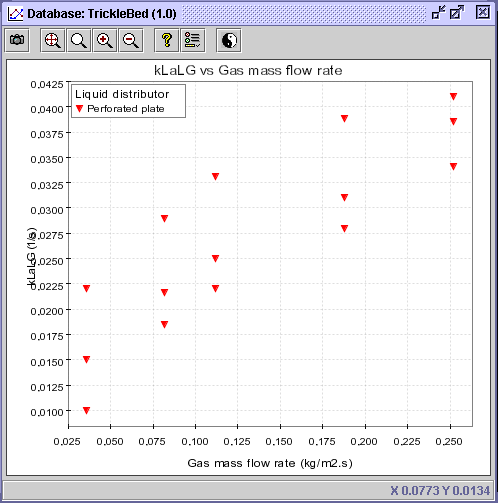
7) To view the general aspects
surrounding liquid distribution, select Liquid distributor from
the Code discrimination option in the Discriminate series  dialog window. A perforated plate was used in Iliuta's work (1996).
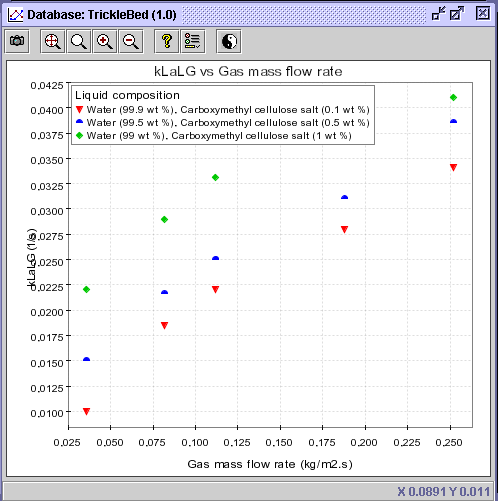
To determine how the liquid viscosity variation was done by Iliuta, the
liquid composition must be examined. Select Liquid composition from
the Code discrimination option in the Discriminate series
  dialog window.
CONCLUSION #2: A single packing shape & material
combination and liquid distributor for the 15 analyzed data sets
in Conclusion #1 were depicted
from the last 4 diagrams. It acknowledges the fact that all other parameters
which were not taken into account in the query do not influence the general
trend discussed in Conclusion #1. Moreover, different carboxymethyl cellulose
salt (CMC) concentrations were employed to increase the liquid viscosity
as presented in the last figure.
 |
 |
 |
Multi_R_Designer
Tutorial |
 |
 |
 |
![]() .
.

![]() .
Choose Gas mass flow rate (Operating conditions: Gas mass flow
rate) in the Horizontal axis panel and Experimental (Mass
transfer: kLaLG: Experimental) in the Vertical
axis panel.
.
Choose Gas mass flow rate (Operating conditions: Gas mass flow
rate) in the Horizontal axis panel and Experimental (Mass
transfer: kLaLG: Experimental) in the Vertical
axis panel.
![]() and choose the Value discrimination option. Write 100 in
the Number of classes box to create 100 equally divided series between
3.18
and 23.4 cP. Press OK. The diagram is effectively divided
into 13 series. However, the observation of a persisting trend remains
difficult. Instead, the liquid viscosity should be divided in 3 equally
spaced series since 3 definite liquid viscosity clusters are covered in
the legend (1: 3.18-3.6 cP; 2: 8.91-10.8 cP; 3: 18.7-23.4
cP). Return to the
Discriminate series dialog window
and choose the Value discrimination option. Write 100 in
the Number of classes box to create 100 equally divided series between
3.18
and 23.4 cP. Press OK. The diagram is effectively divided
into 13 series. However, the observation of a persisting trend remains
difficult. Instead, the liquid viscosity should be divided in 3 equally
spaced series since 3 definite liquid viscosity clusters are covered in
the legend (1: 3.18-3.6 cP; 2: 8.91-10.8 cP; 3: 18.7-23.4
cP). Return to the
Discriminate series dialog window ![]() and change 13 for 4 (By trial and error, 4 equally divided
series gives a better diagram).
and change 13 for 4 (By trial and error, 4 equally divided
series gives a better diagram).
![]() and choose the Code discrimination option. Select first the
Packing
type option from the combo list
and choose the Code discrimination option. Select first the
Packing
type option from the combo list ![]() and press OK. It shows that all 15 experiments were carried
out with a spherical packing. Secondly, select the Packing material
option and press OK. A single packing material, namely SiO
2/Al2O3/Cr2O3 catalyst
material was used.
and press OK. It shows that all 15 experiments were carried
out with a spherical packing. Secondly, select the Packing material
option and press OK. A single packing material, namely SiO
2/Al2O3/Cr2O3 catalyst
material was used.
![]() dialog window. A perforated plate was used in Iliuta's work (1996).
To determine how the liquid viscosity variation was done by Iliuta, the
liquid composition must be examined. Select Liquid composition from
the Code discrimination option in the Discriminate series
dialog window. A perforated plate was used in Iliuta's work (1996).
To determine how the liquid viscosity variation was done by Iliuta, the
liquid composition must be examined. Select Liquid composition from
the Code discrimination option in the Discriminate series ![]() dialog window.
dialog window.
